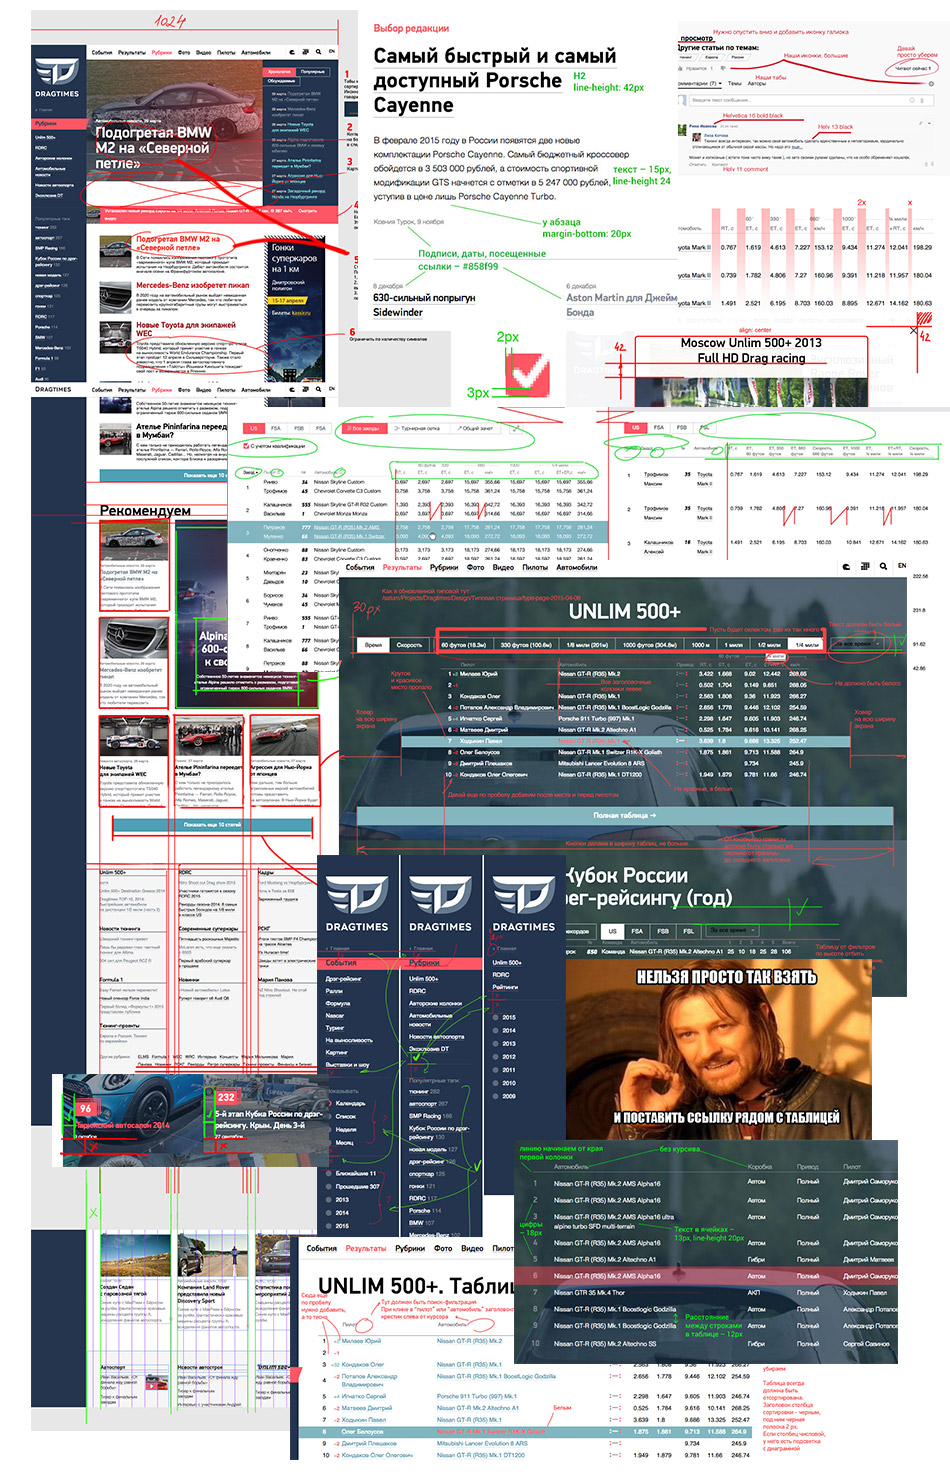
Our work on the concept resulted in a couple of pages. Using them, we now need to create a graphic language and styles of the future website.
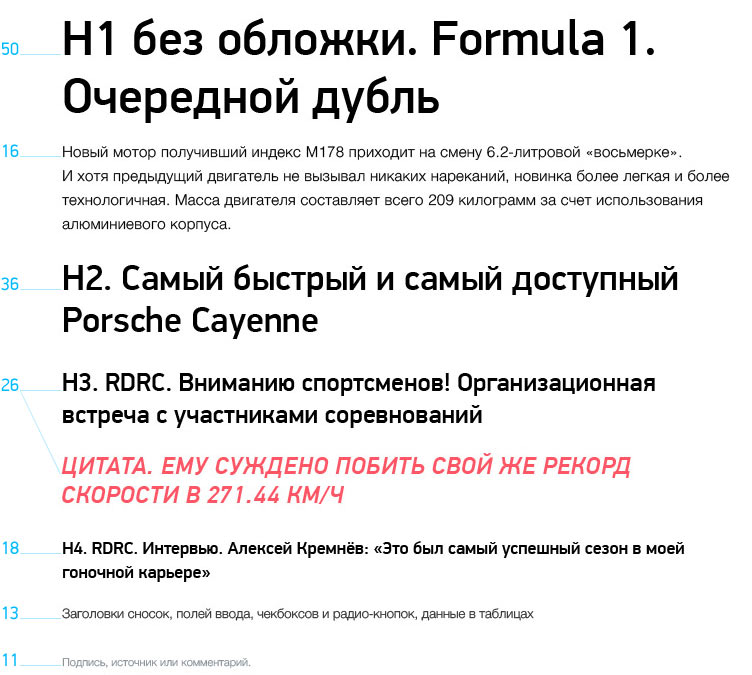
Starting with typography. Deciding on the number of styles we need.
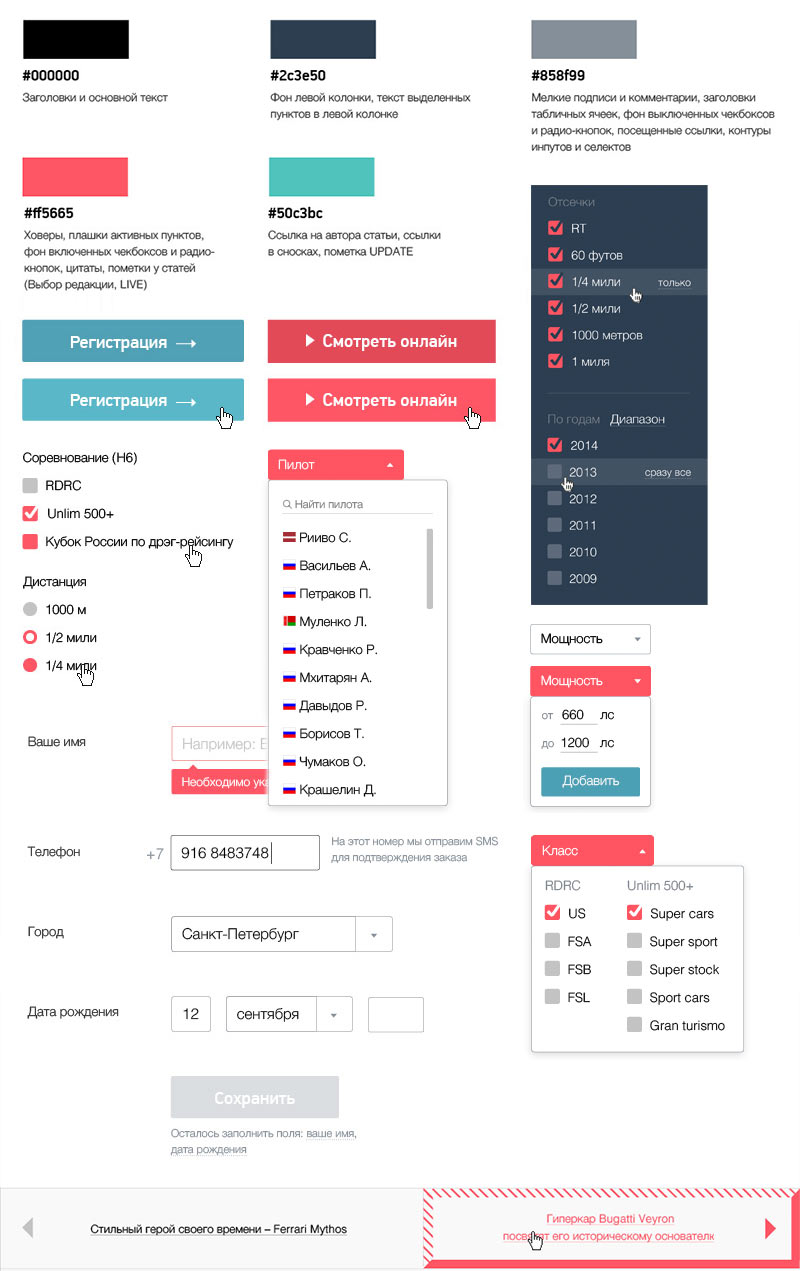
Creating the minimum required set of functional and style elements based on those used in the concept.
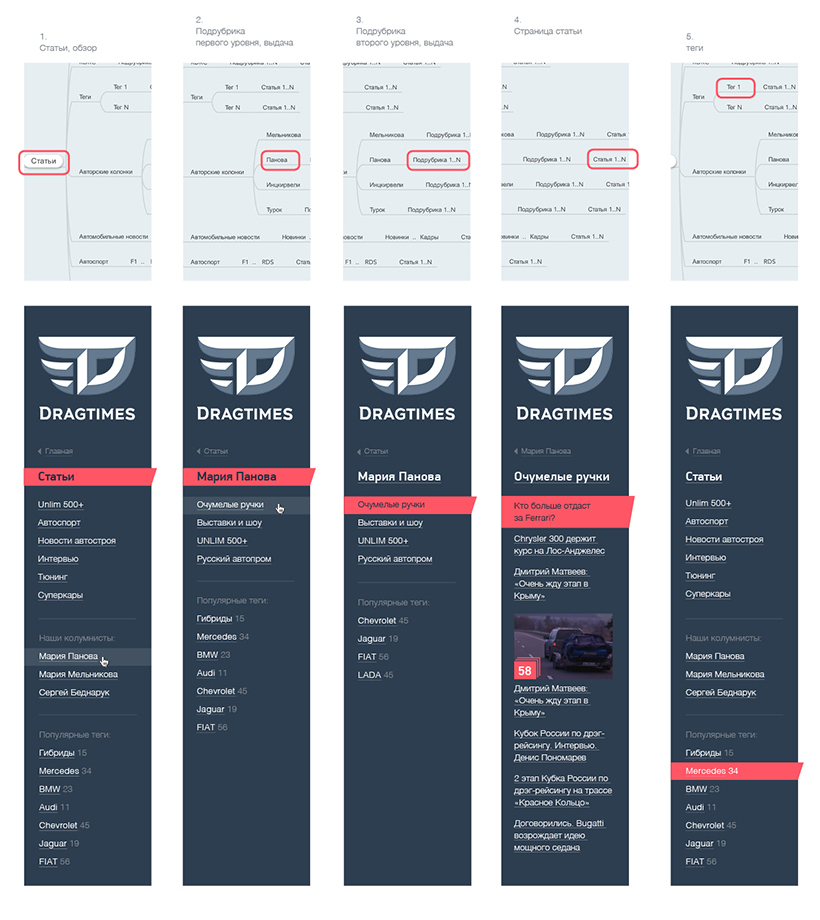
Deciding on the principle of navigation in the left column and indication of the current page.
Rendering the logo in all required formats.
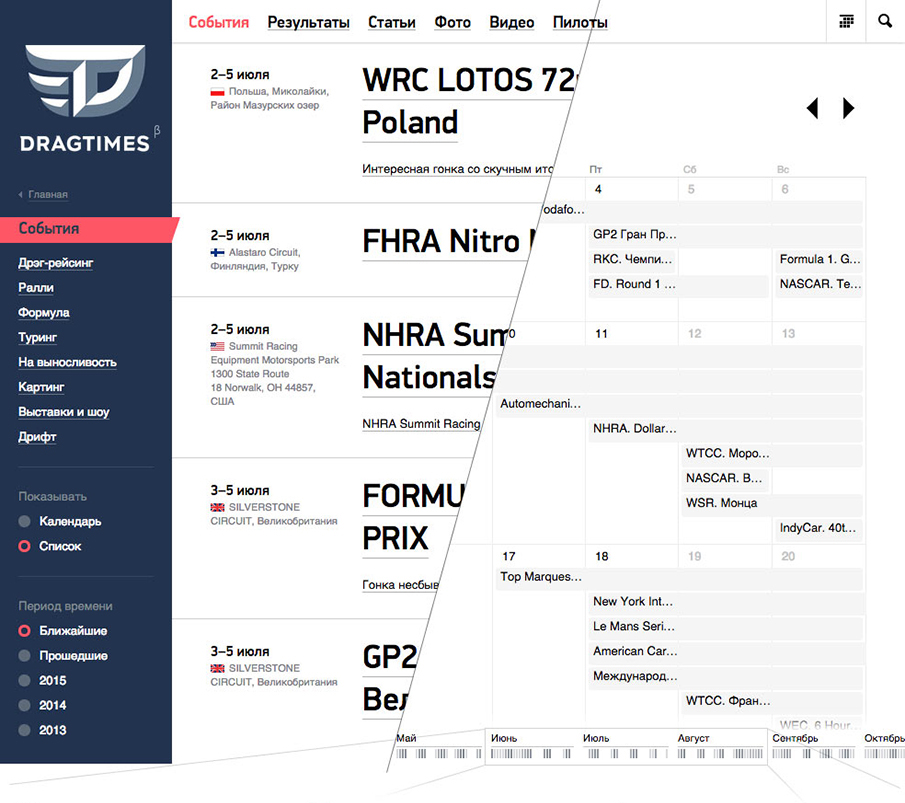
Putting the top menu in order.

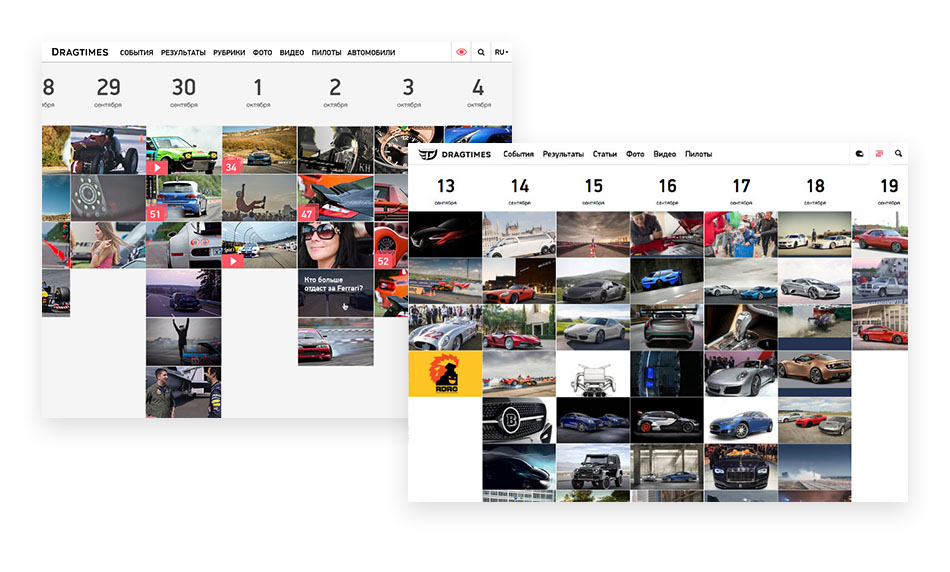
Starting to work on the internal sections. Deciding to create two views for events, a list and a calendar. Showing event load of each month at the bottom.
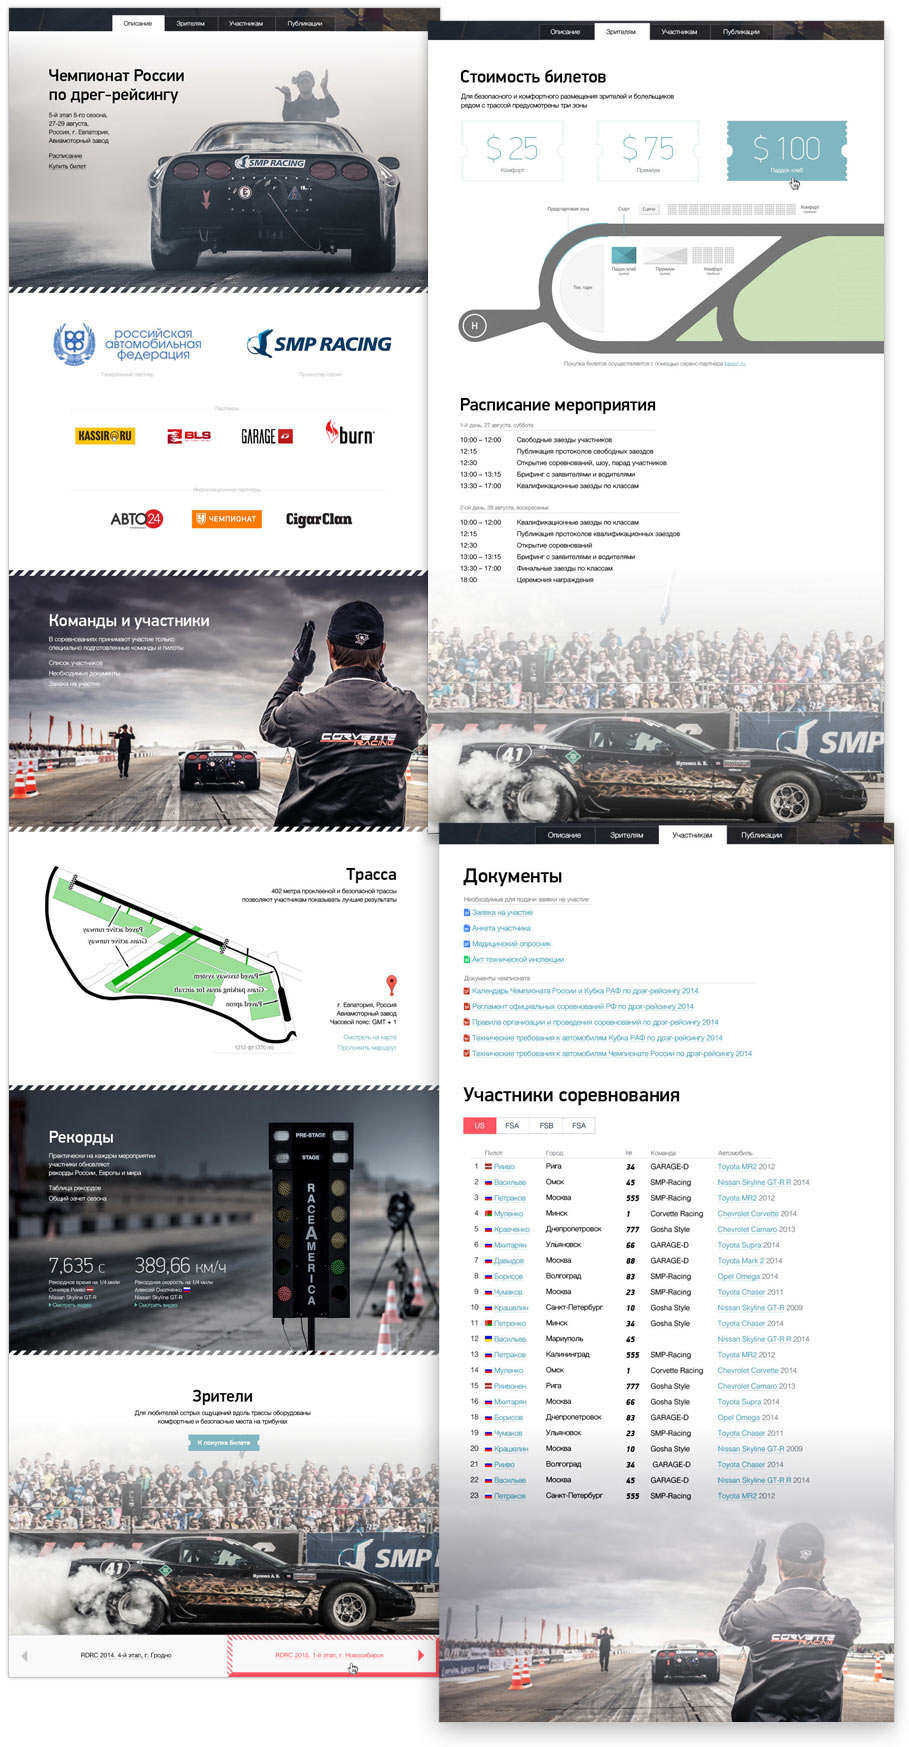
Moving on to the event page. Using tabs under the cover to implement second-level navigation.
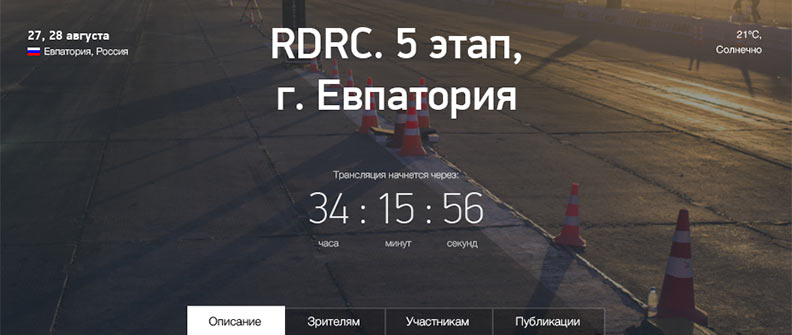
The tabs will contain event description, results and information for visitors and participants, depending on the type of the event.

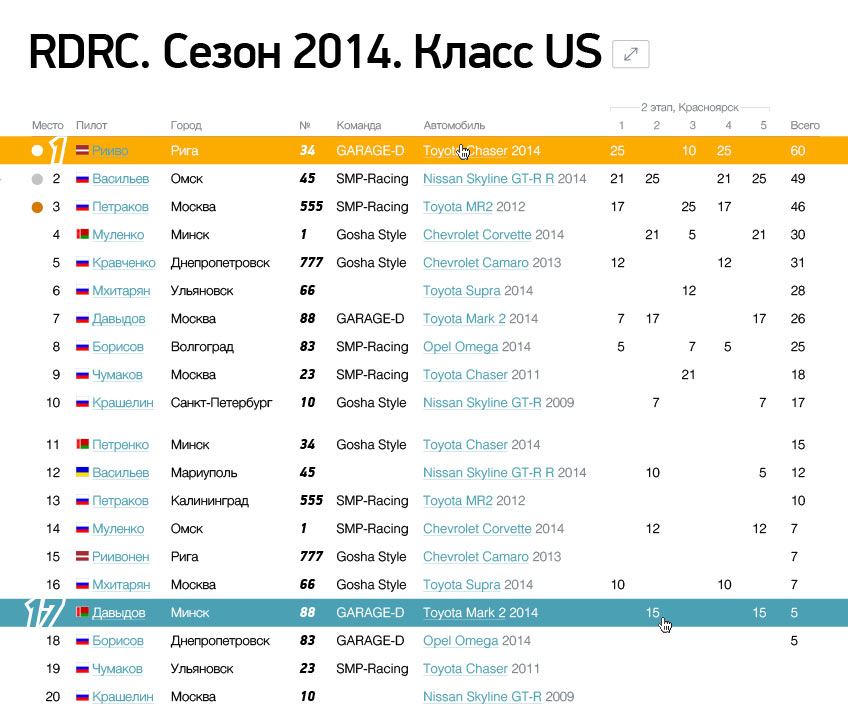
Next up is the race results section.
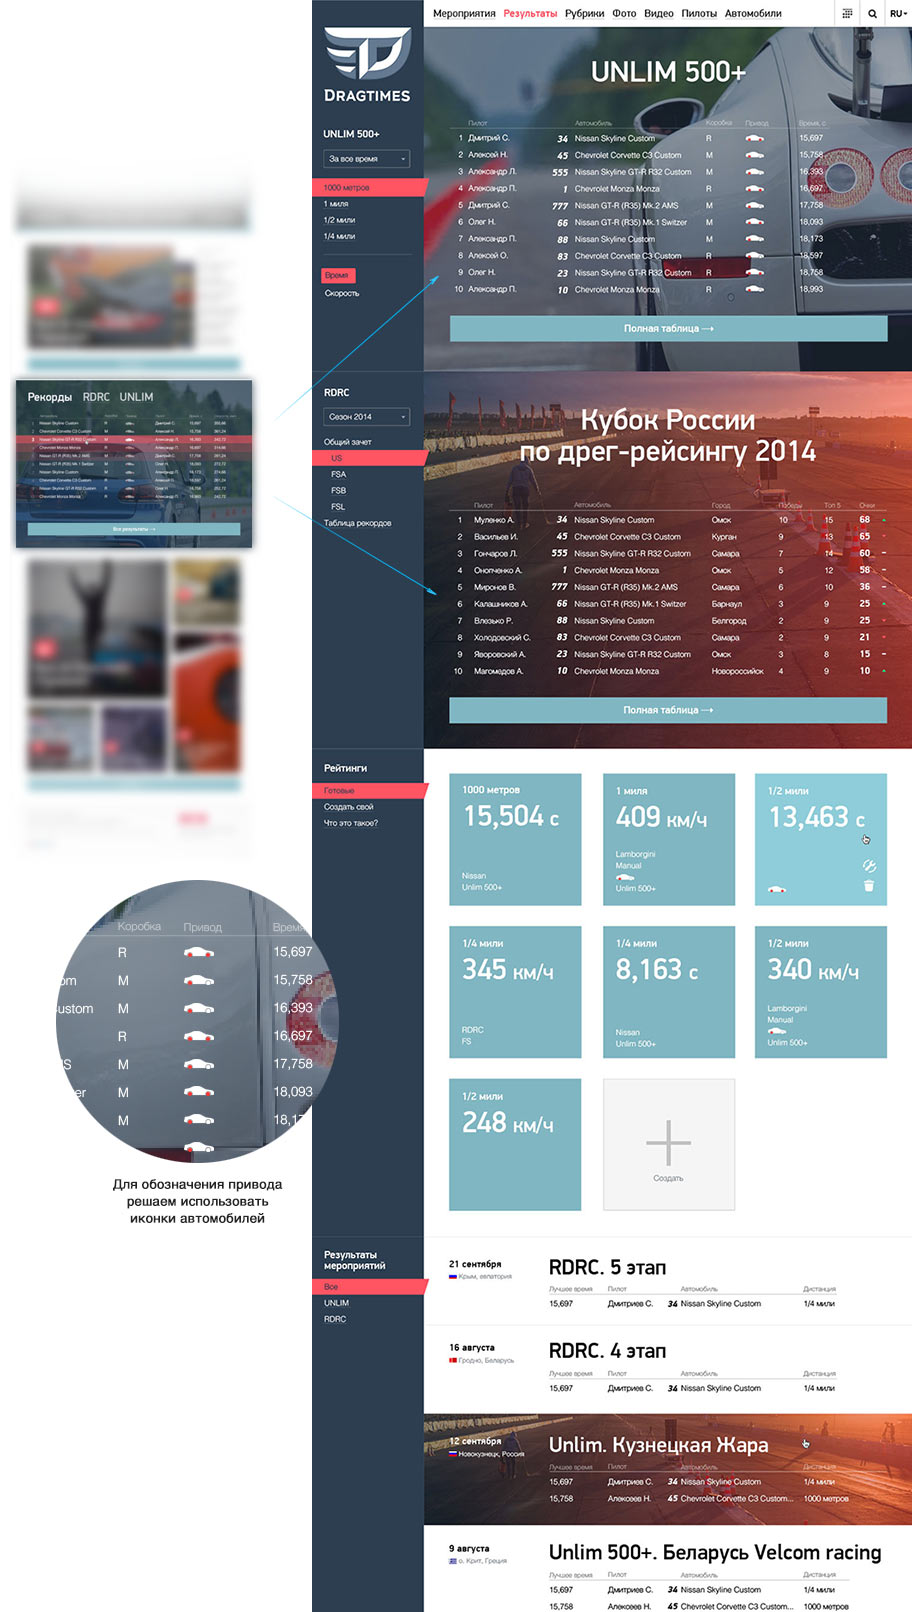
Replacing photos with illustrations.
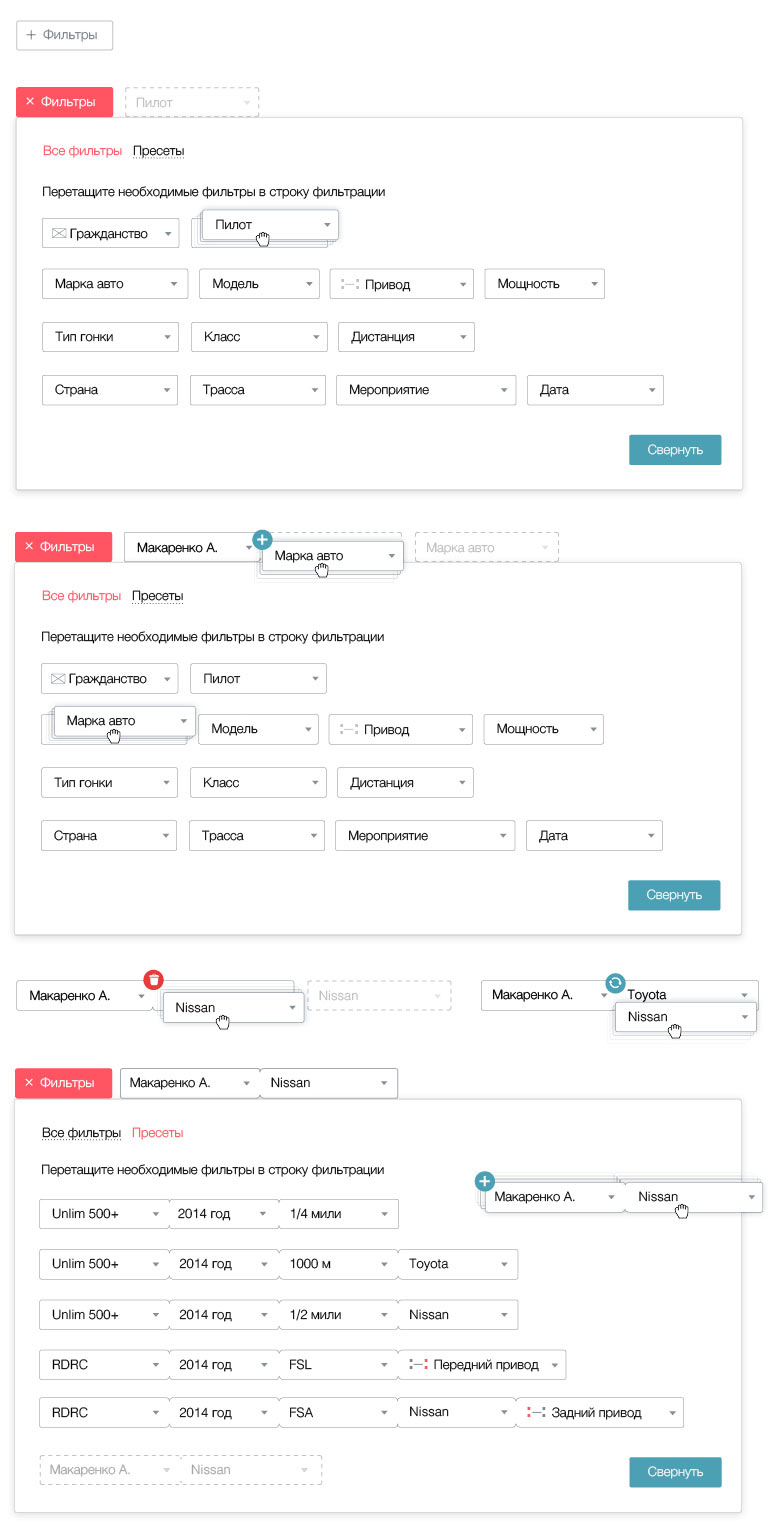
Creating a special set of controls for the rating filter.
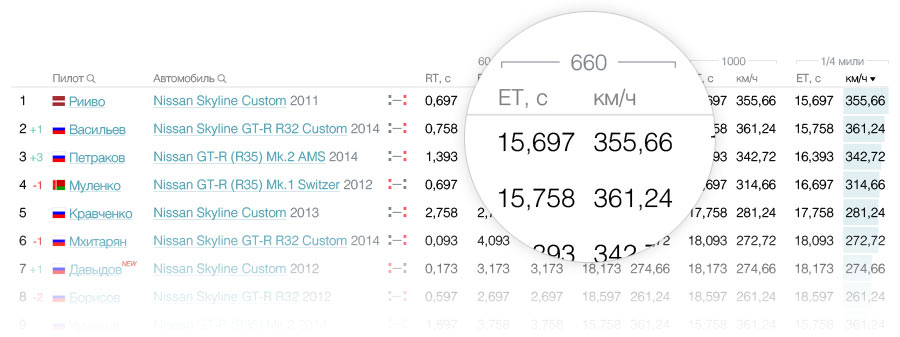
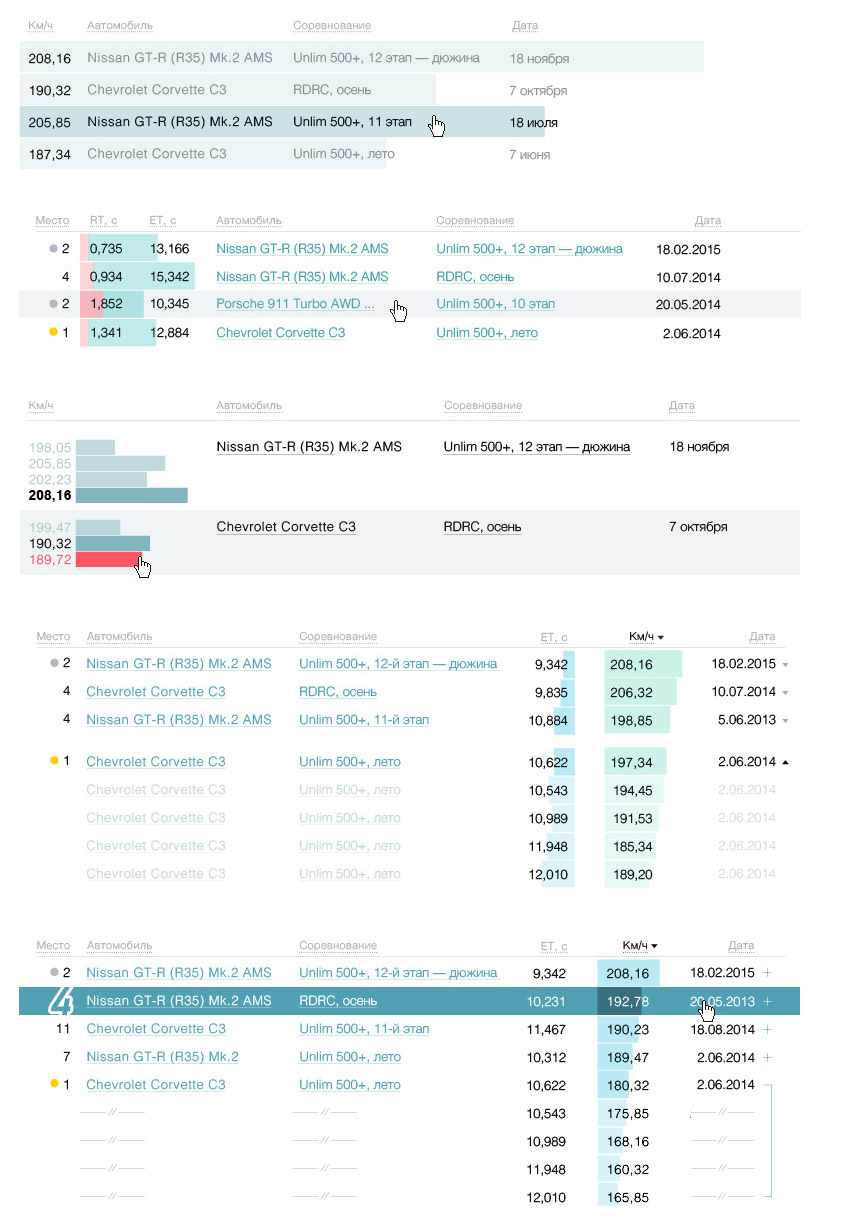
Polishing small details in tables. Several parameters are measured at checkpoints, combining them with a bracket.
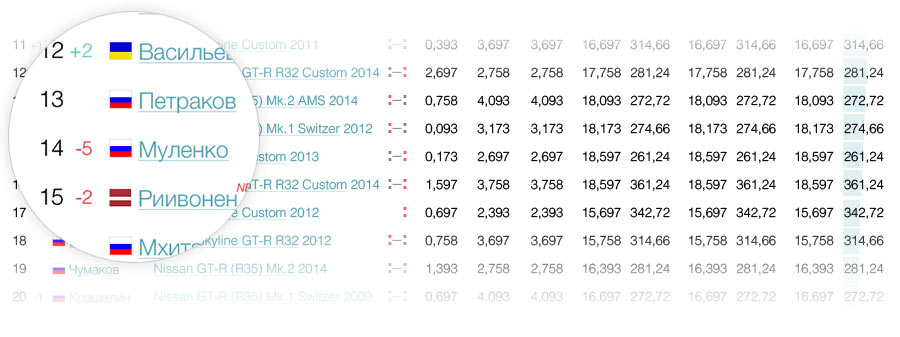
Adding a separate column to indicate the driver’s progression through the overall record list.
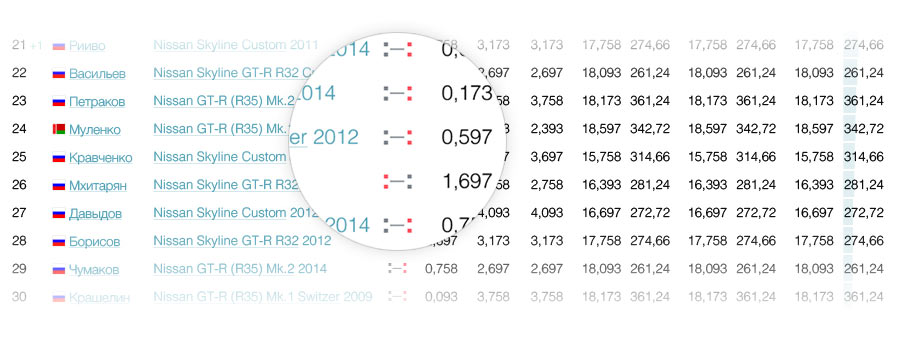
Deciding to use a text icon instead of a car illustration to show drivetrain type: colon, dash, colon. The text car drives left to right. Vroom! :—:
The column selected for sorting will have a diagram of sorted values as a background.
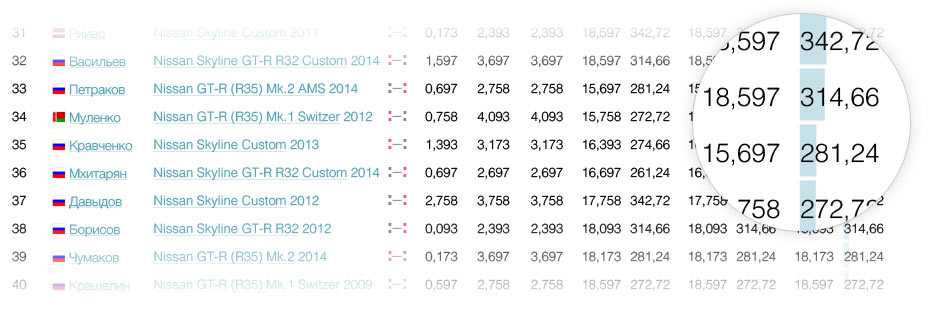
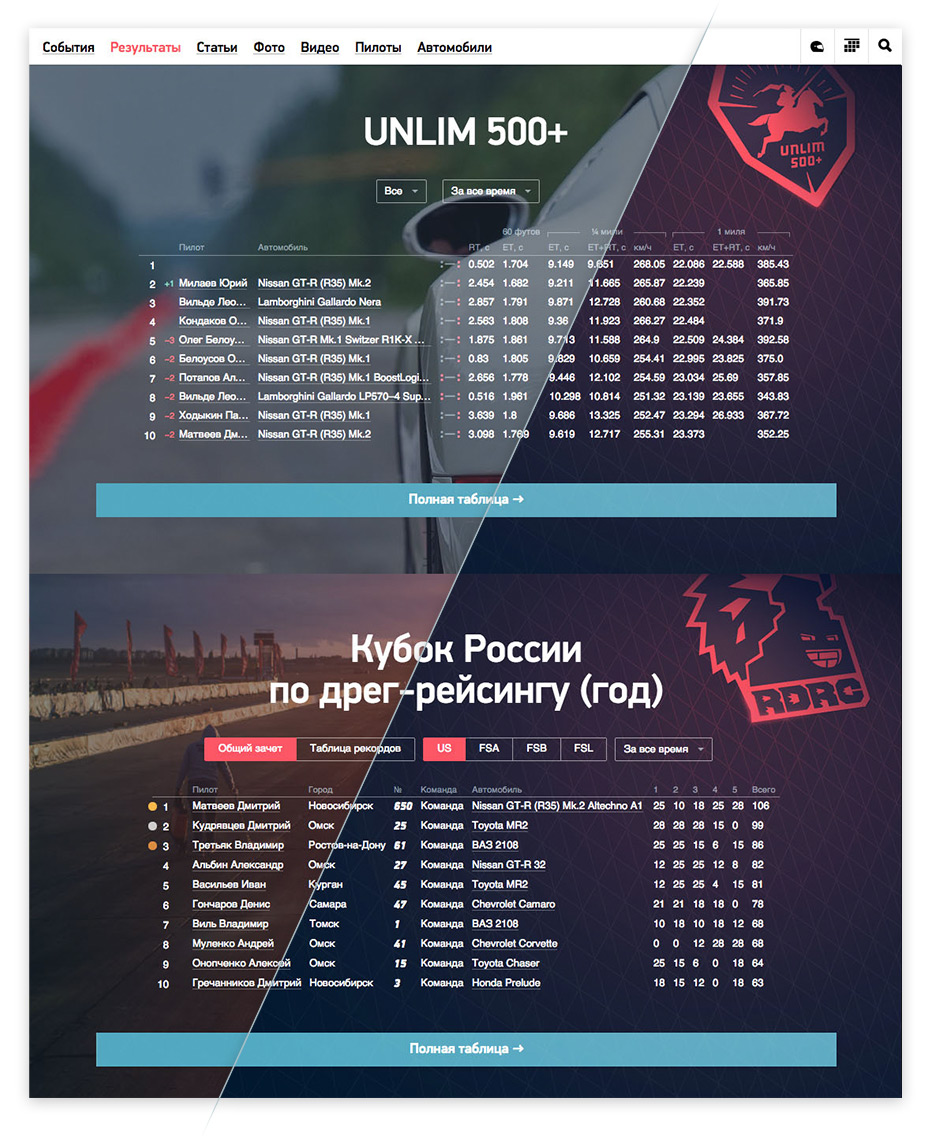
The tables will have a blank line after each ten rows to make it easy to see top ten, top twenty, etc. results. Hard-earned prizes will be displayed for the drivers who made it to the top and their row hover color will match the color of their medal.
Working on the layout to make tables as informative as possible.
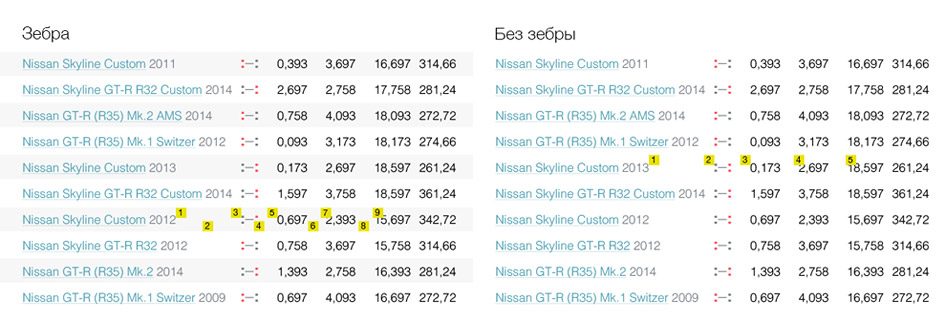
The client has concerns about readability of the tables and asks to try highlighting every other row with a different color. Doing so adds noise to the table, deciding not to use the idea. Explaining the reason to the client: while looking at the table, users read the lines one after another, using the closest emphasis to the right to orientate themselves. Adding different background for every other row will create twice as many elements competing for the users’ attention which would make reading the table more straining.
We end up with quite a few formats for presenting the results. Creating a small diagram to make sure other people working on the project understand their relationship.

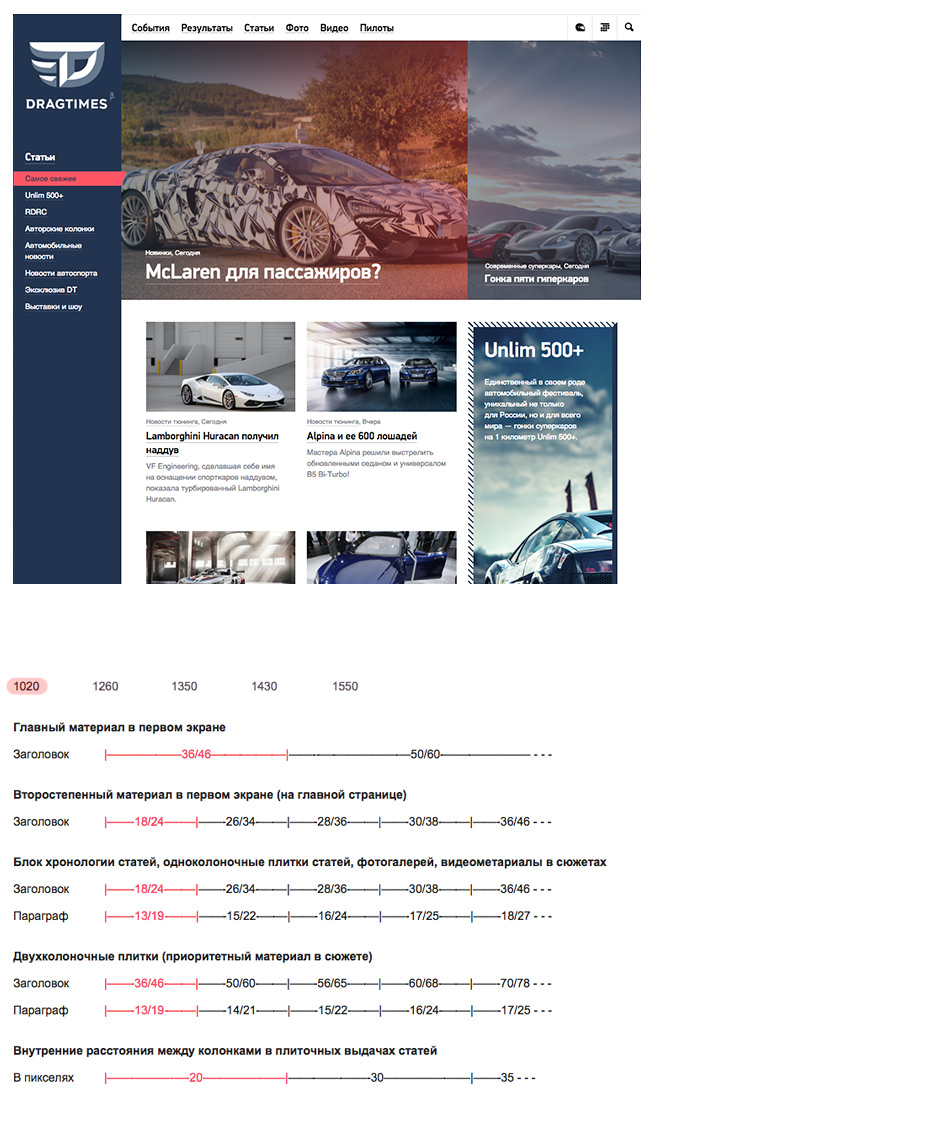
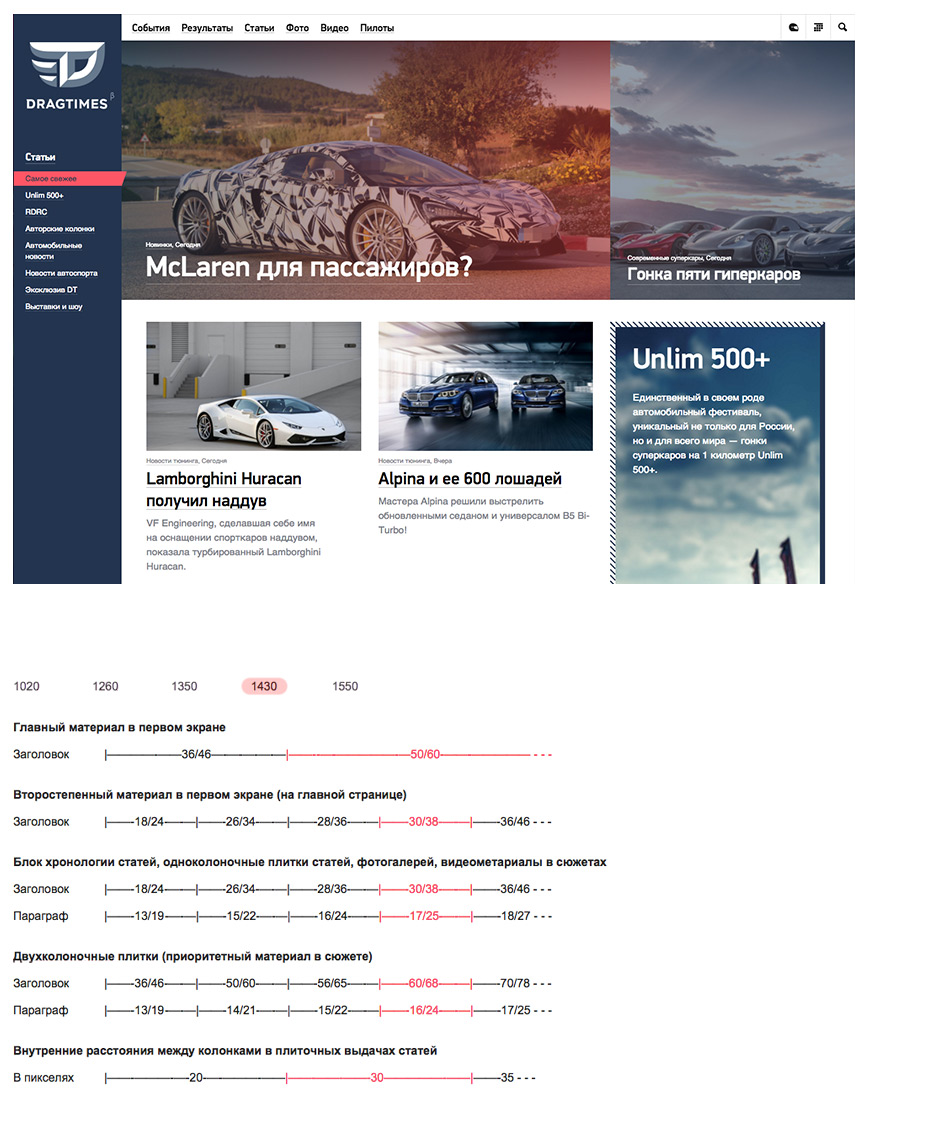
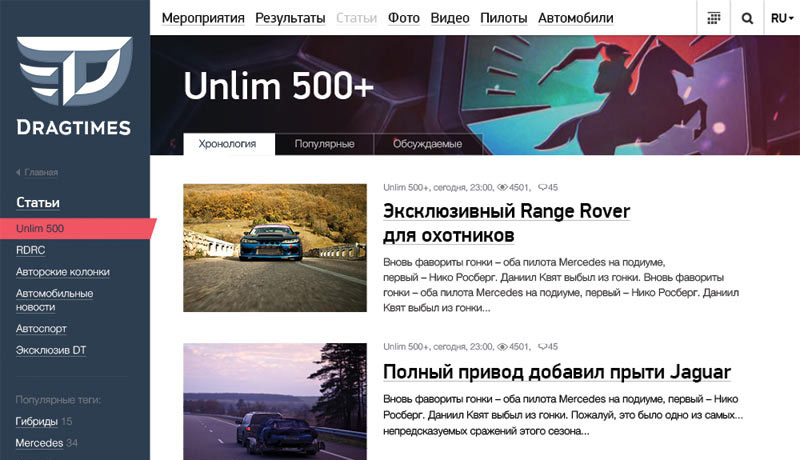
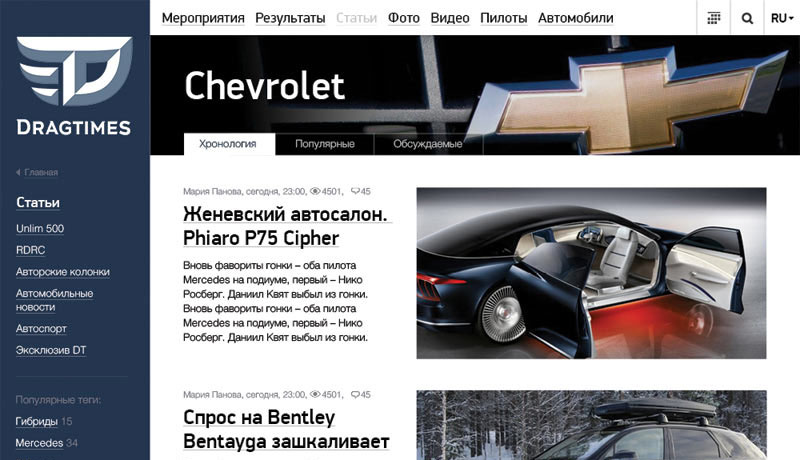
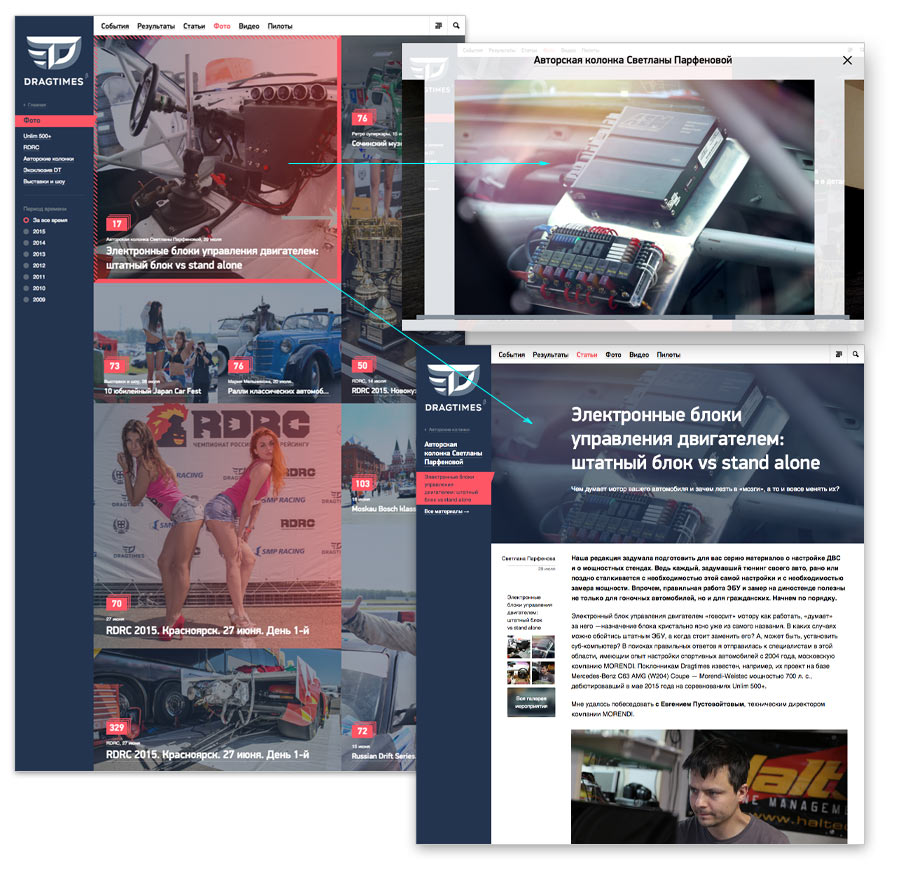
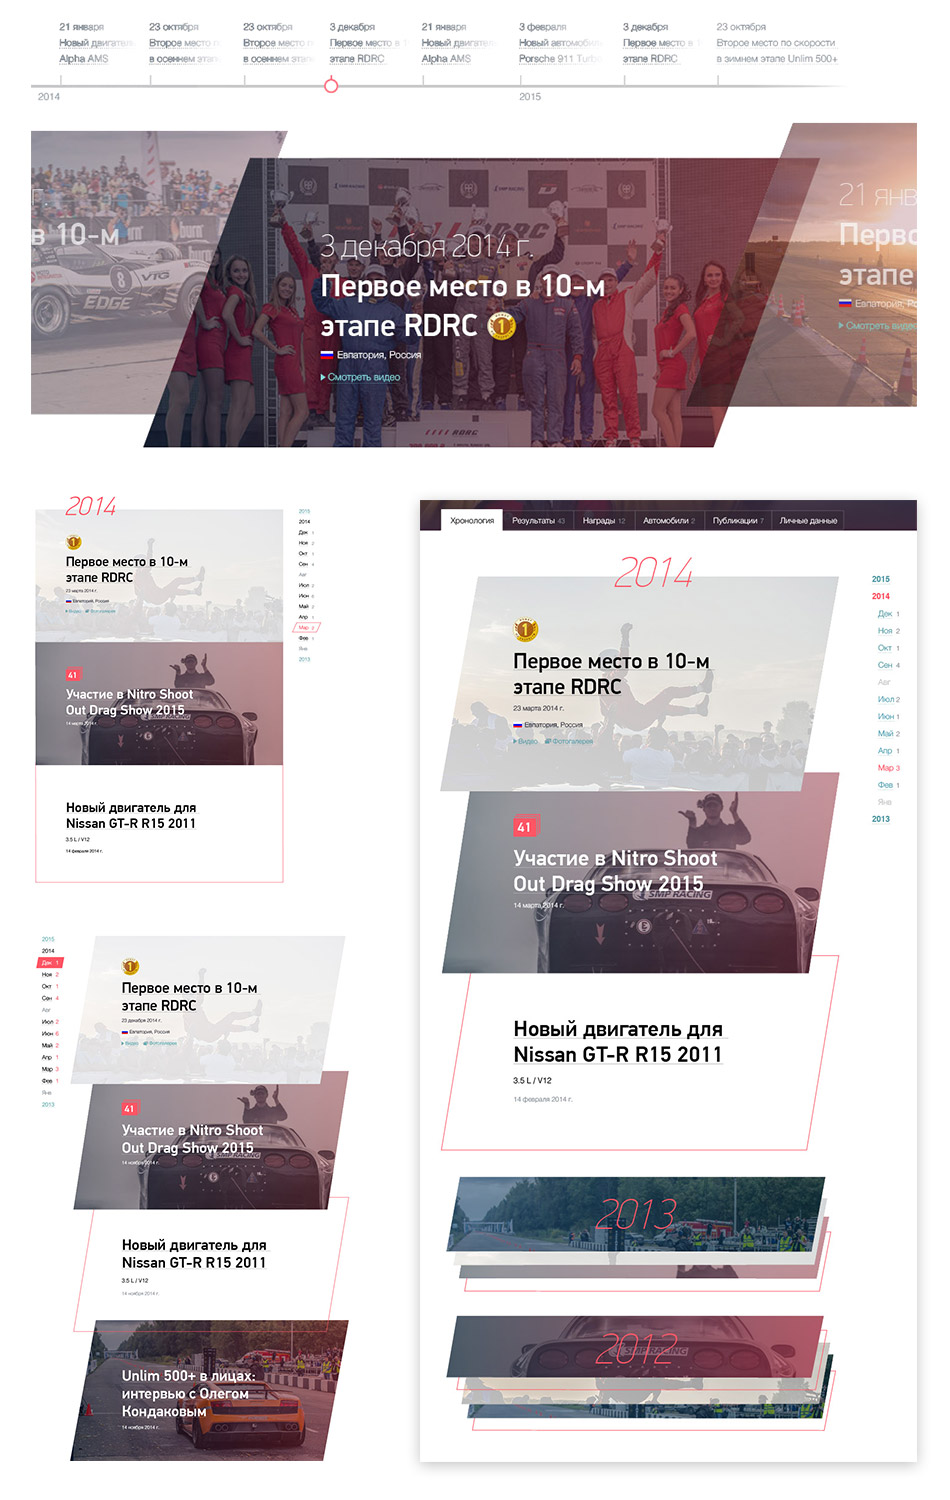
While everyone is busy with the diagram, moving on to the new section. Articles are one of the main assets of the website. This section needs to keep the viewers updated from the moment they open it. Experimenting with layout and formats on the first page of the section.
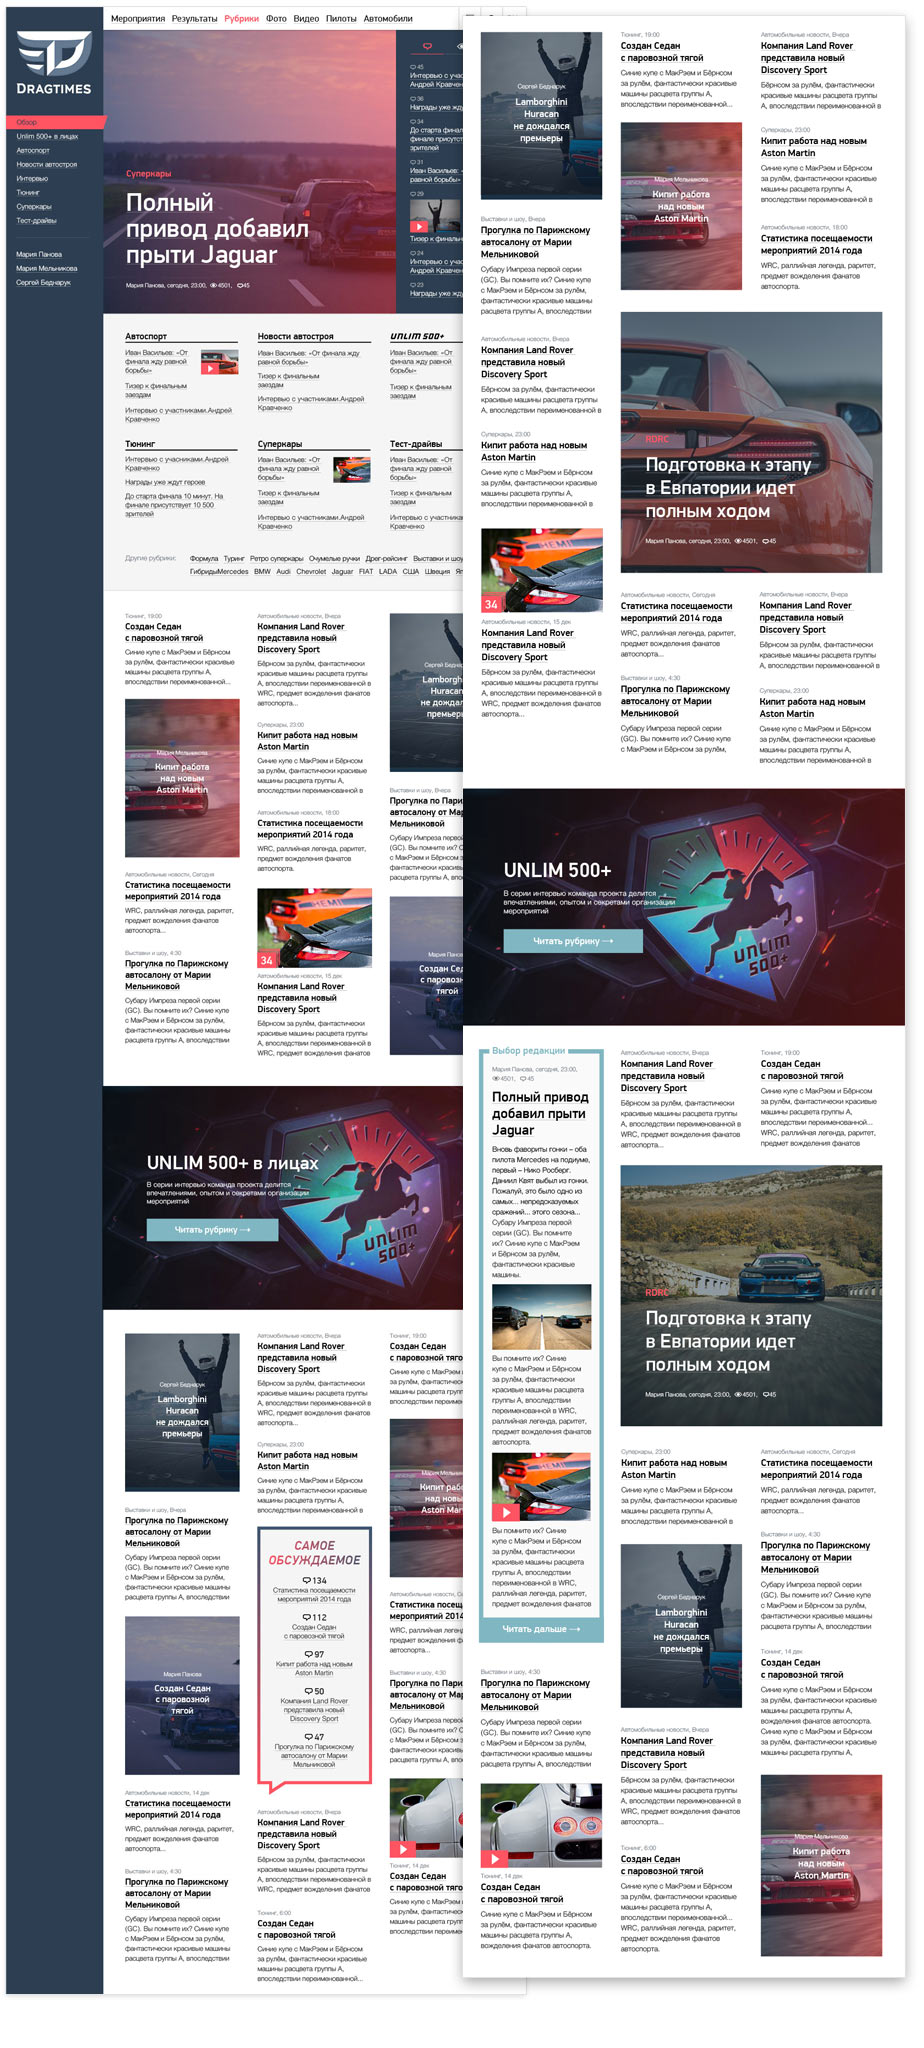
Client: Let’s bring it closer to real life. 8 or maybe 9 out of 10 articles will have photos. I would like you to think about how to create a feed with latest news items here. Right now we don’t use it because we don’t have the tools to do it, but in fact over 40 records were broken at the latest event in Yevpatoria alone and we had no way to immediately cover them.
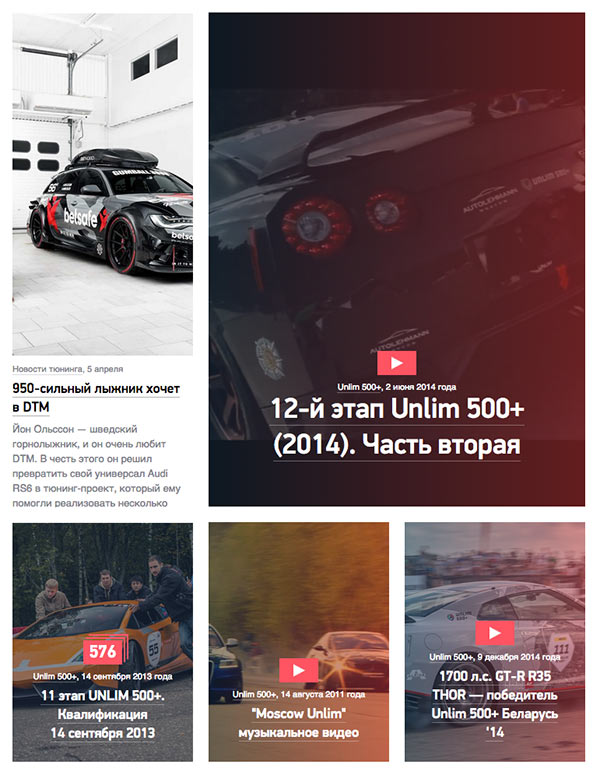
To maintain the viewers’ interest, giving a new tool to the editors: stories. They will always follow the chronological news block and will be created based on the subject.
To prevent all stories from looking the same, making the grid change depending on the number of articles in the story.
Creating an individual format and indicators for each publication type to allow the viewer to see whether it’s an article, a photo gallery or a video.
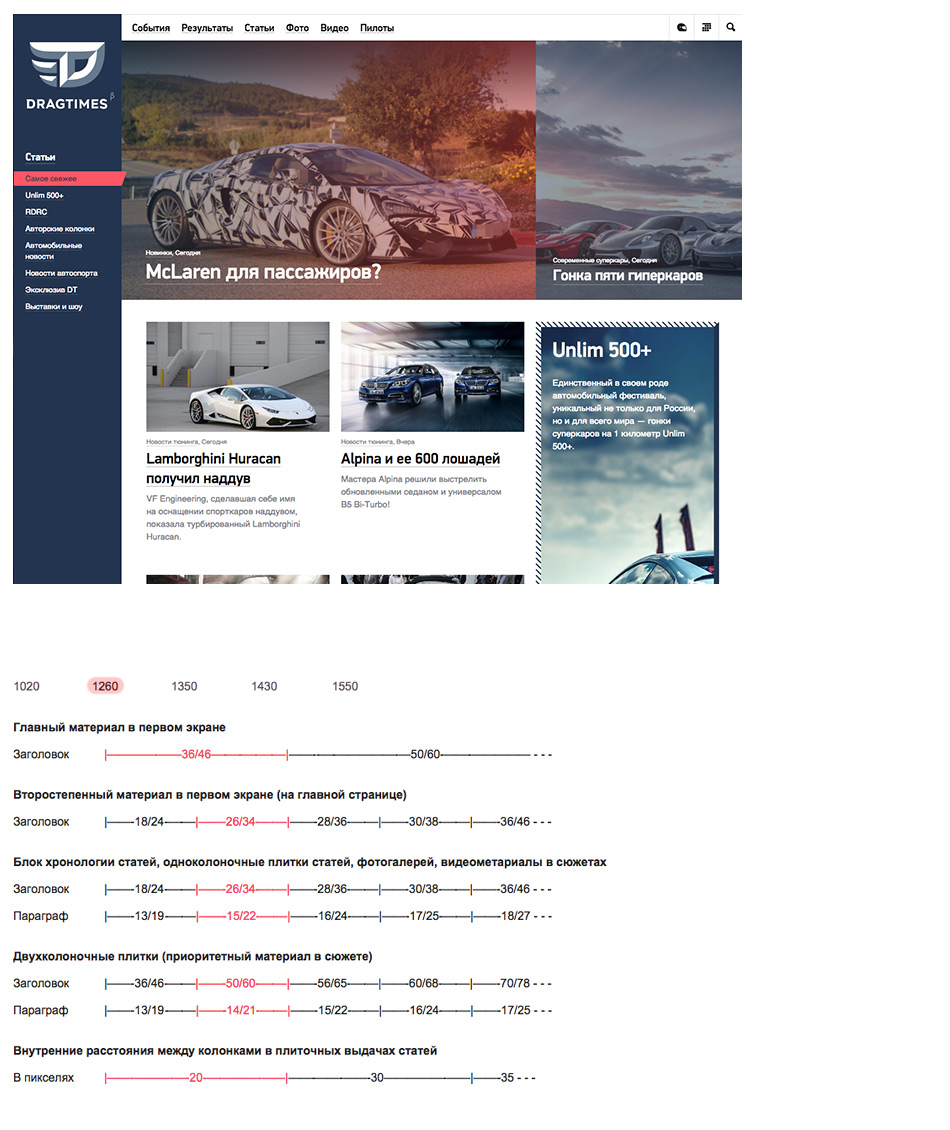
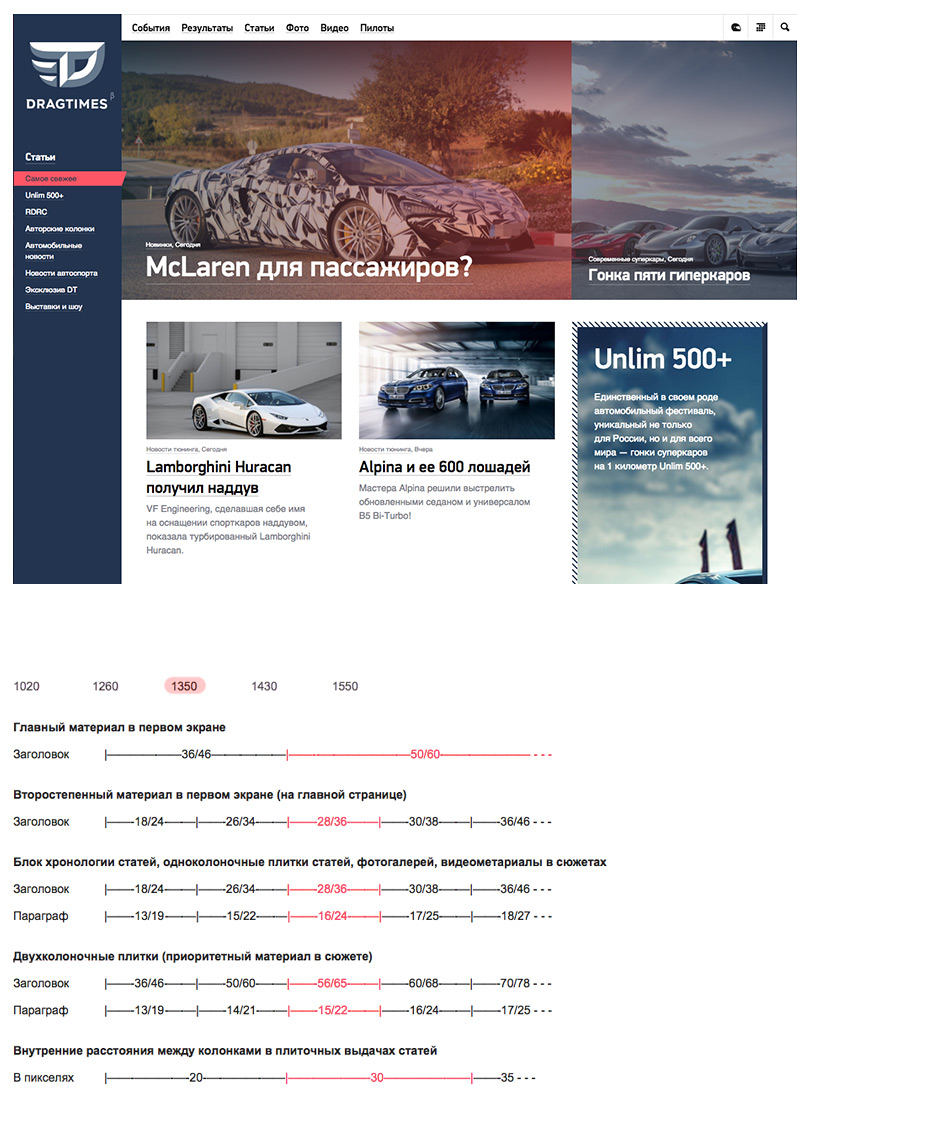
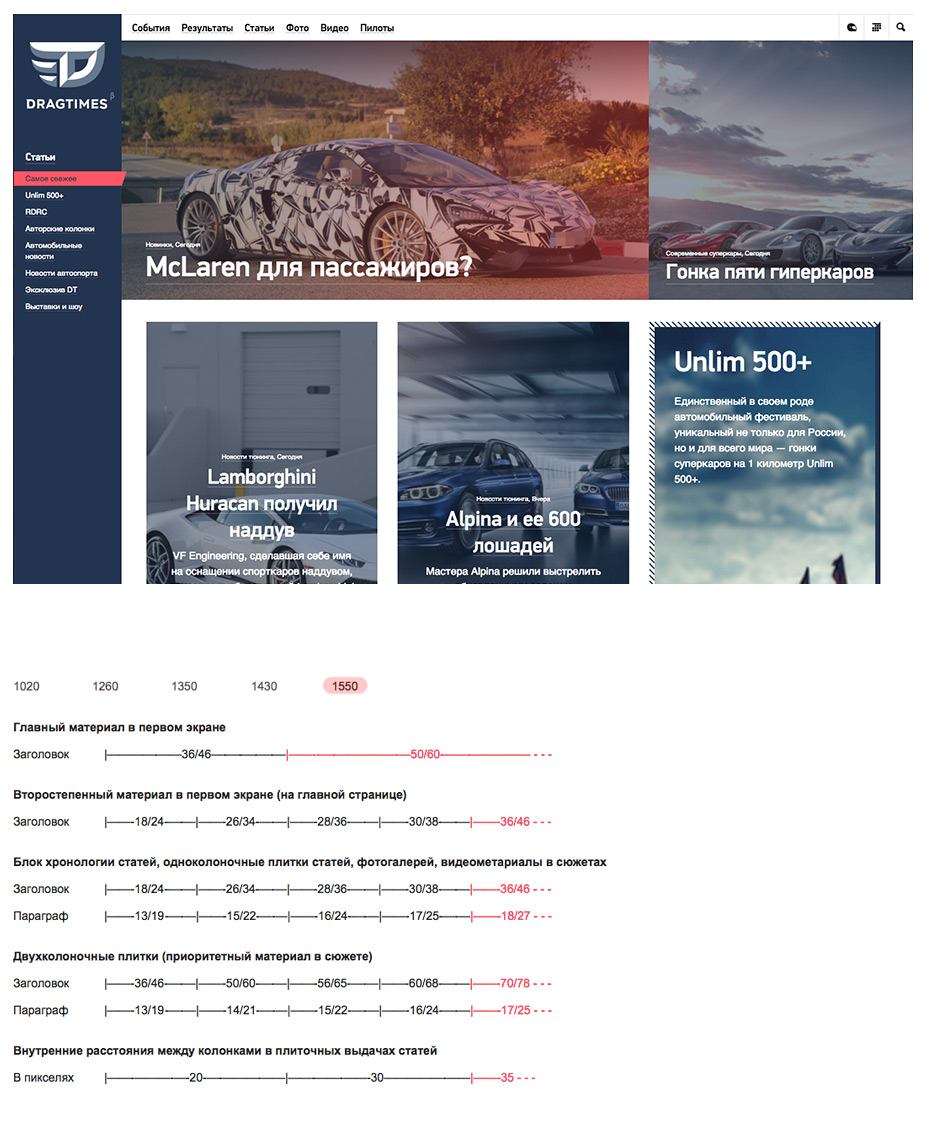
Creating rules for adaptive text styles to get rid of gaps on widescreen monitors.
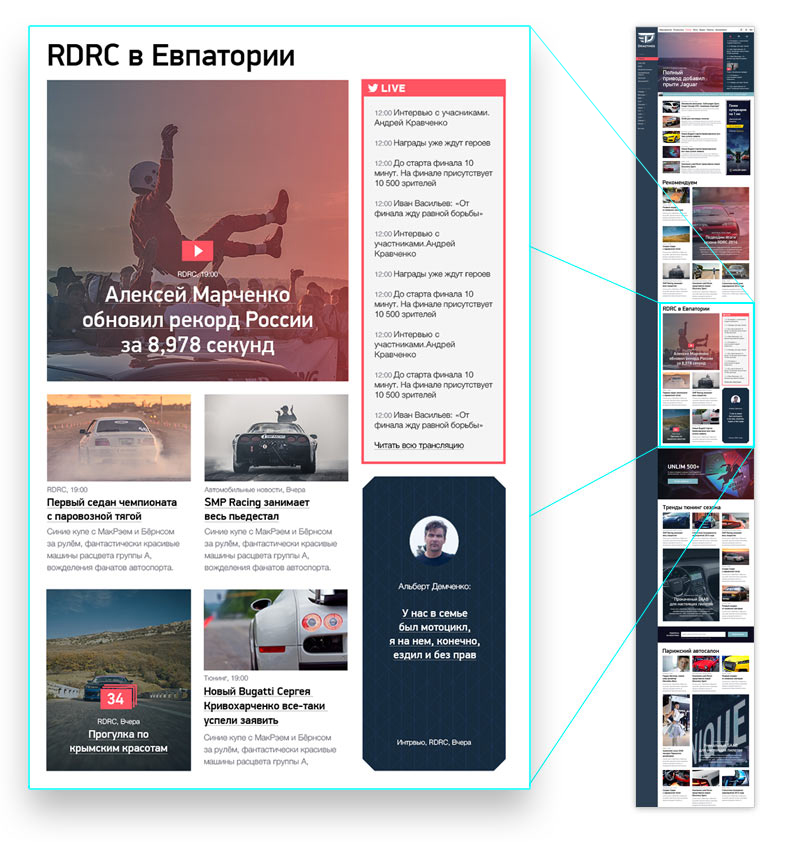
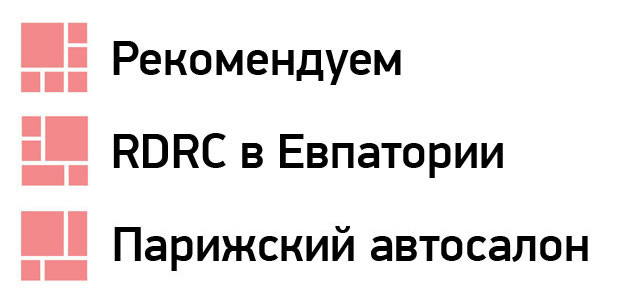
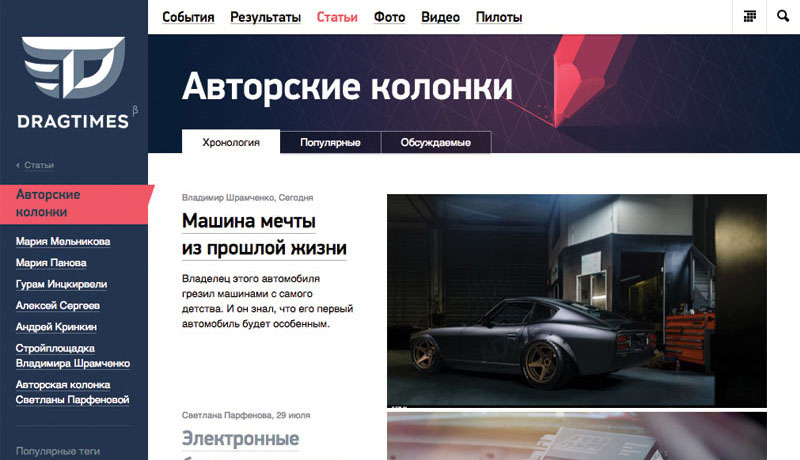
The number of stories on a page is unlimited. Inserting links to interesting sections between the stories. Each section has its own illustration.
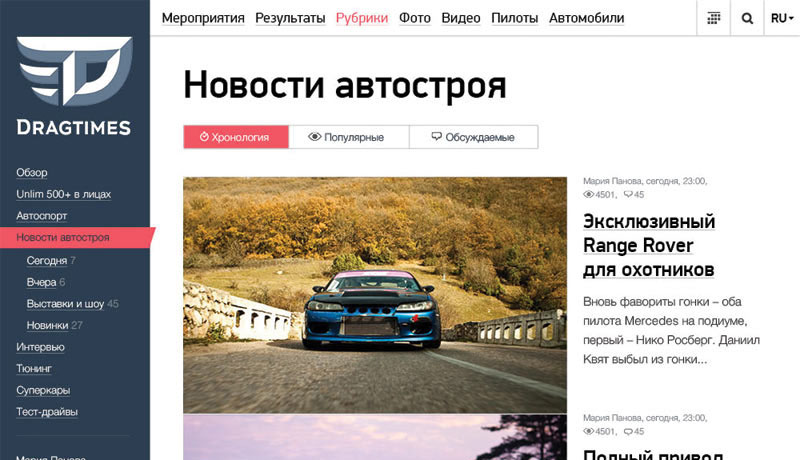
Illustrations are also used on the covers of internal pages of each section.

Working with the Photo and Video sections is slightly easier as they share the same logic. Putting all media in tiles on the first page of each section, similar to the main page of the concept. Deciding to get rid of fat white margins, sticking the items together and elaborating the logic of building the page depending on the number of publications.
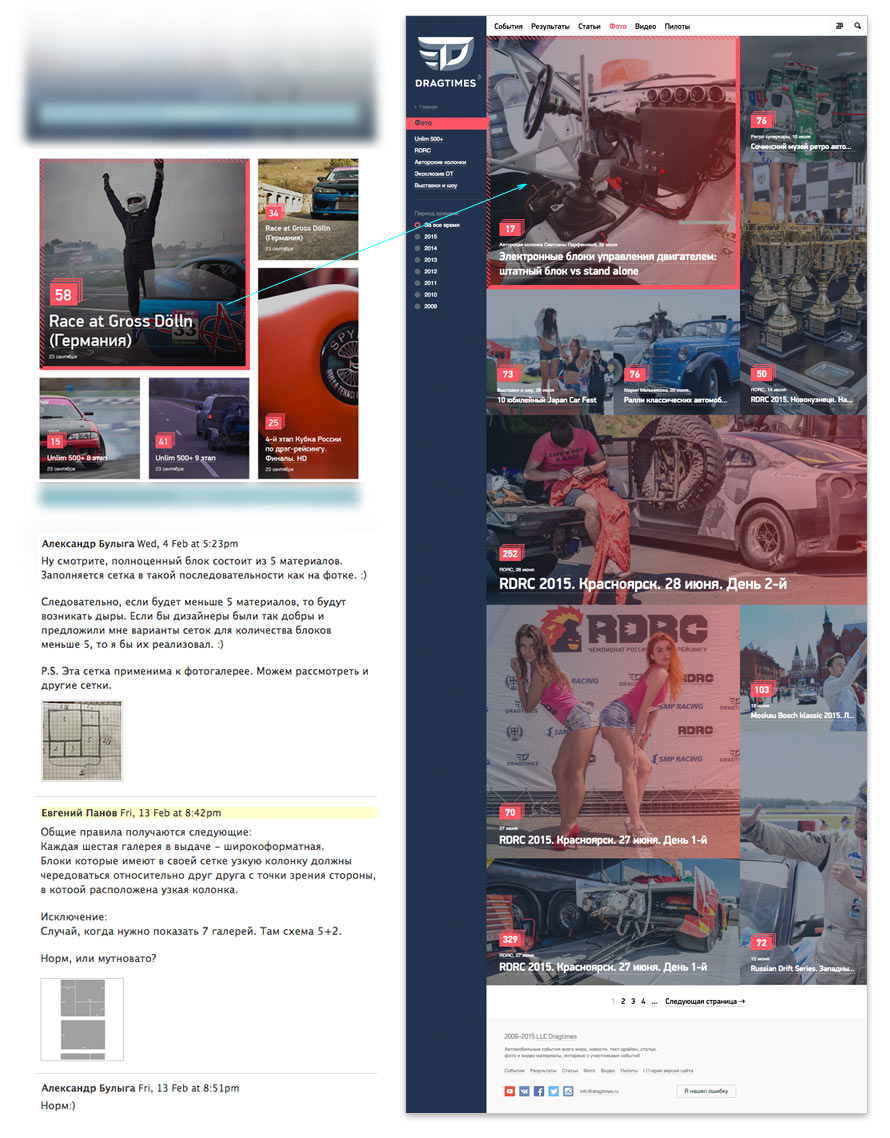
Clicking a tile will open a quick view, clicking a link will take to the publication page.

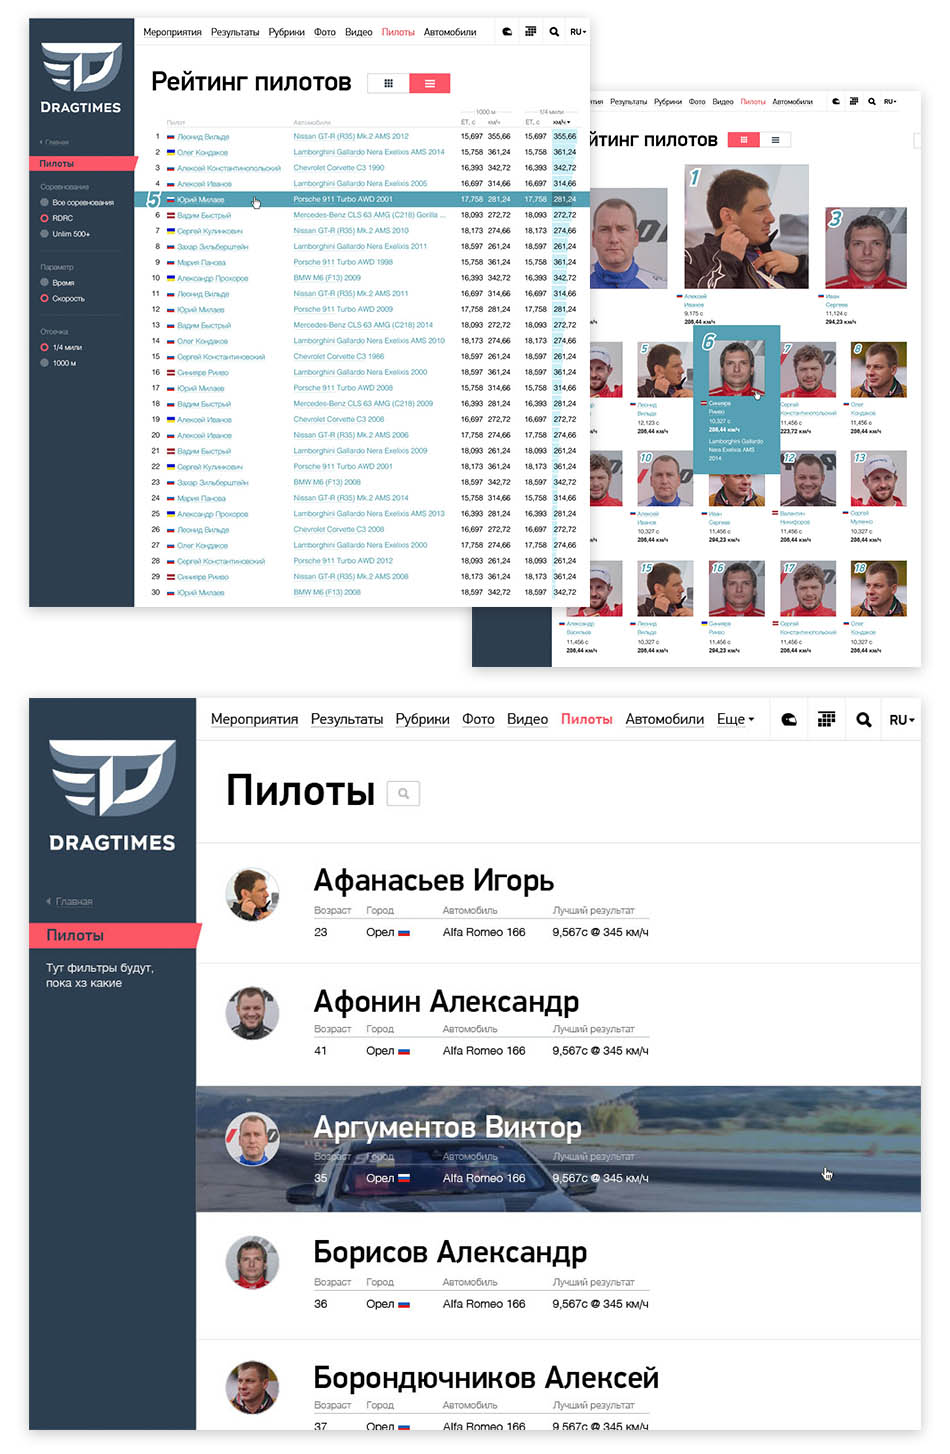
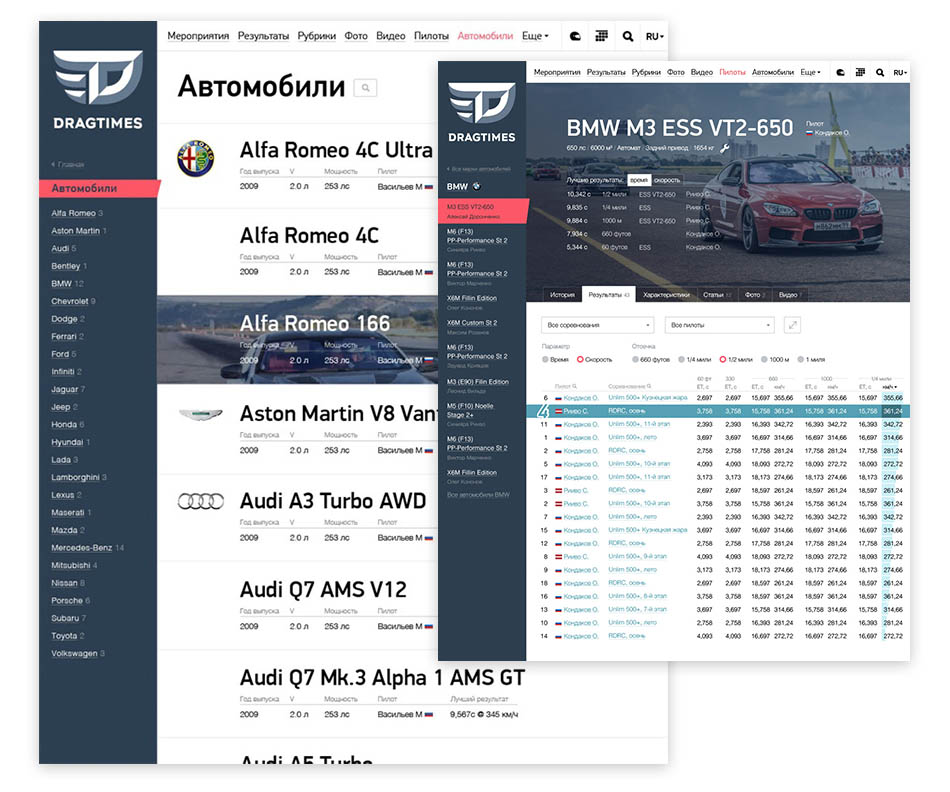
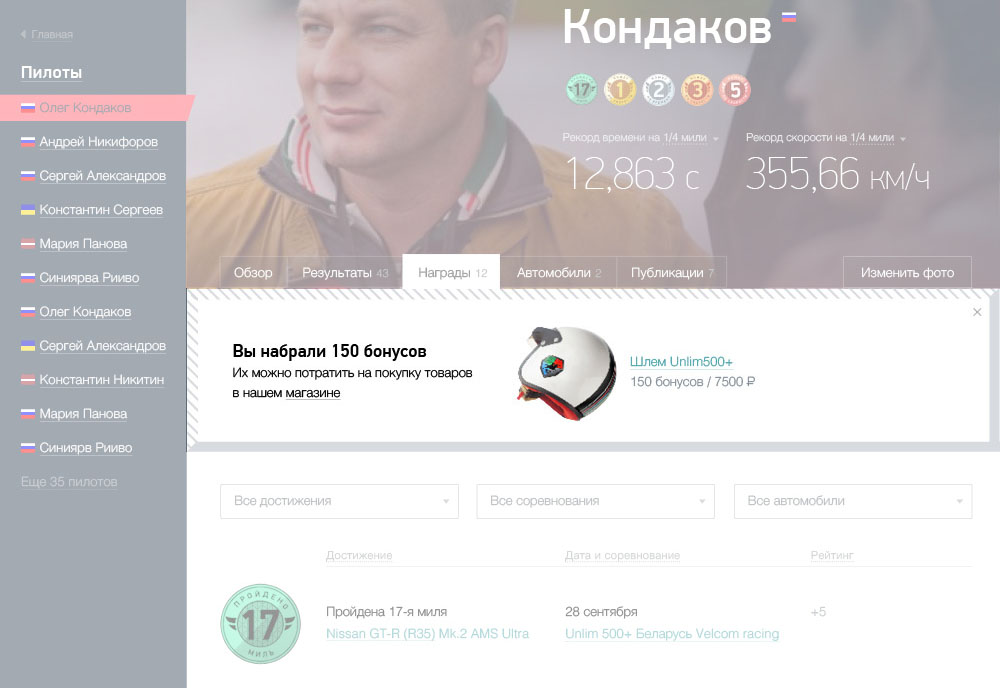
Starting to work on the Drivers section. Thinking about the format of the drivers list.
Now the driver page. Here we need to show the driver’s results, information about their cars and achievements as icons.
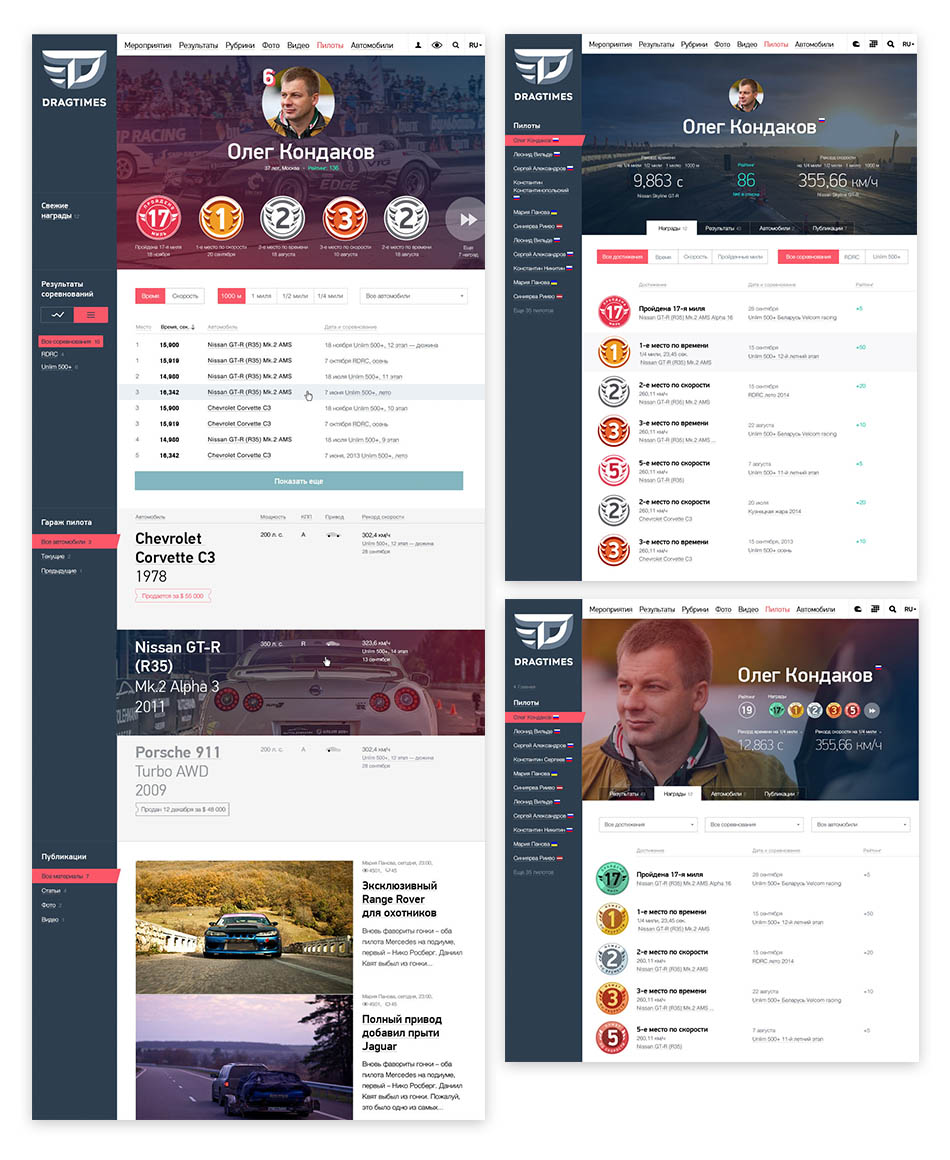
Working on the driver’s results table. Creating the diagram layout and grouping of results by heats.
Deciding to make a timeline with main events from the driver’s biography. Trying different options for placing the events, settling on a vertical feed.
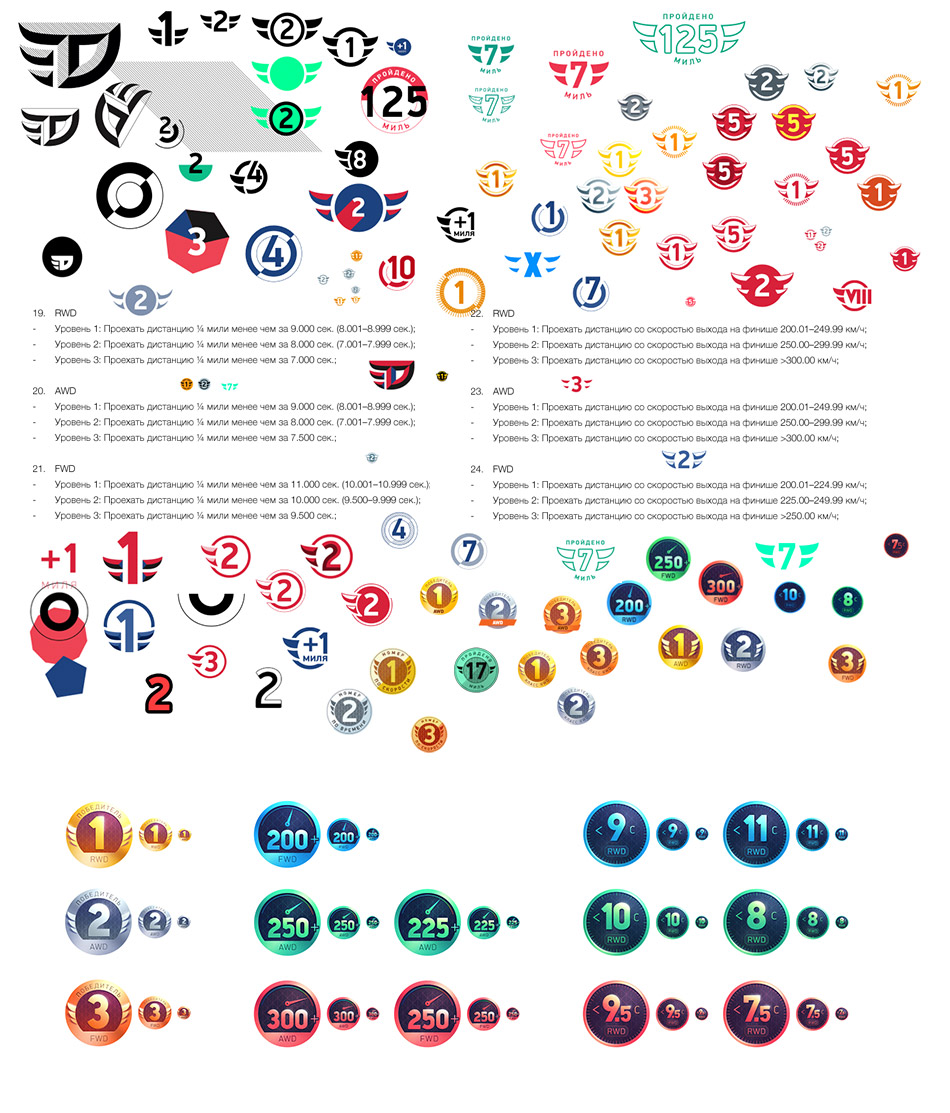
Drawing achievement icons.

Now the cars. Planning for each car to have a photo of a required format.
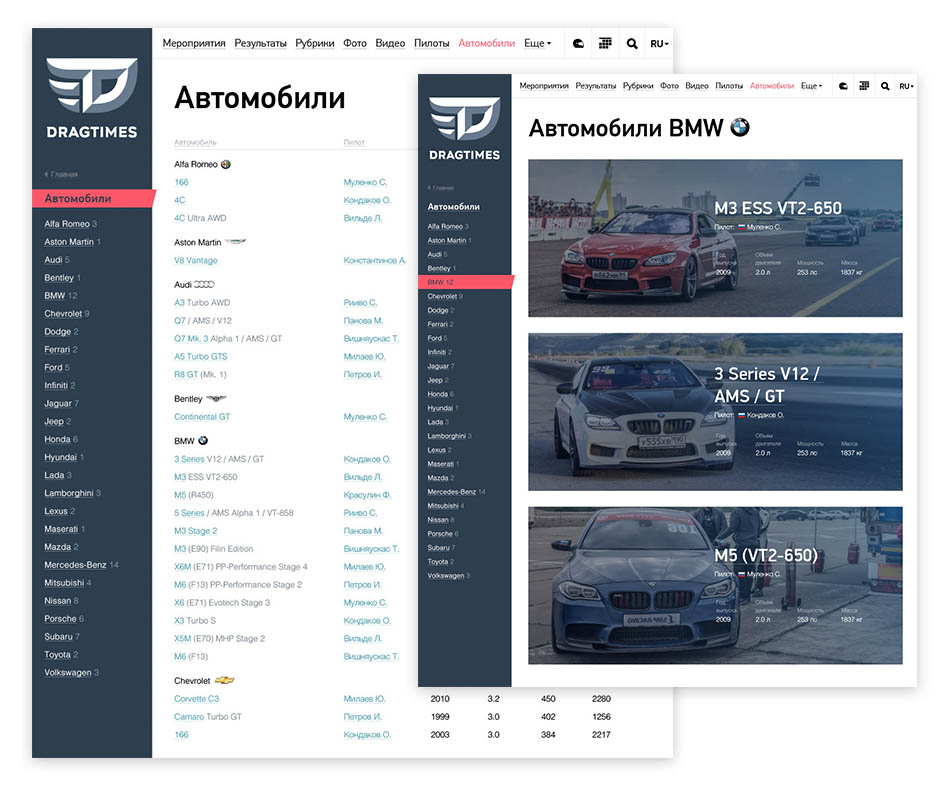
Client: Most likely there will be hundreds of cars, not every one of them with a photo.
Senior designer: Let’s make the section simpler by creating a single-level list with photographs that appear on hover, similar to the drivers list. Typeset the car page following the design of the driver page.

Time to work on the online store. Making the first approach.
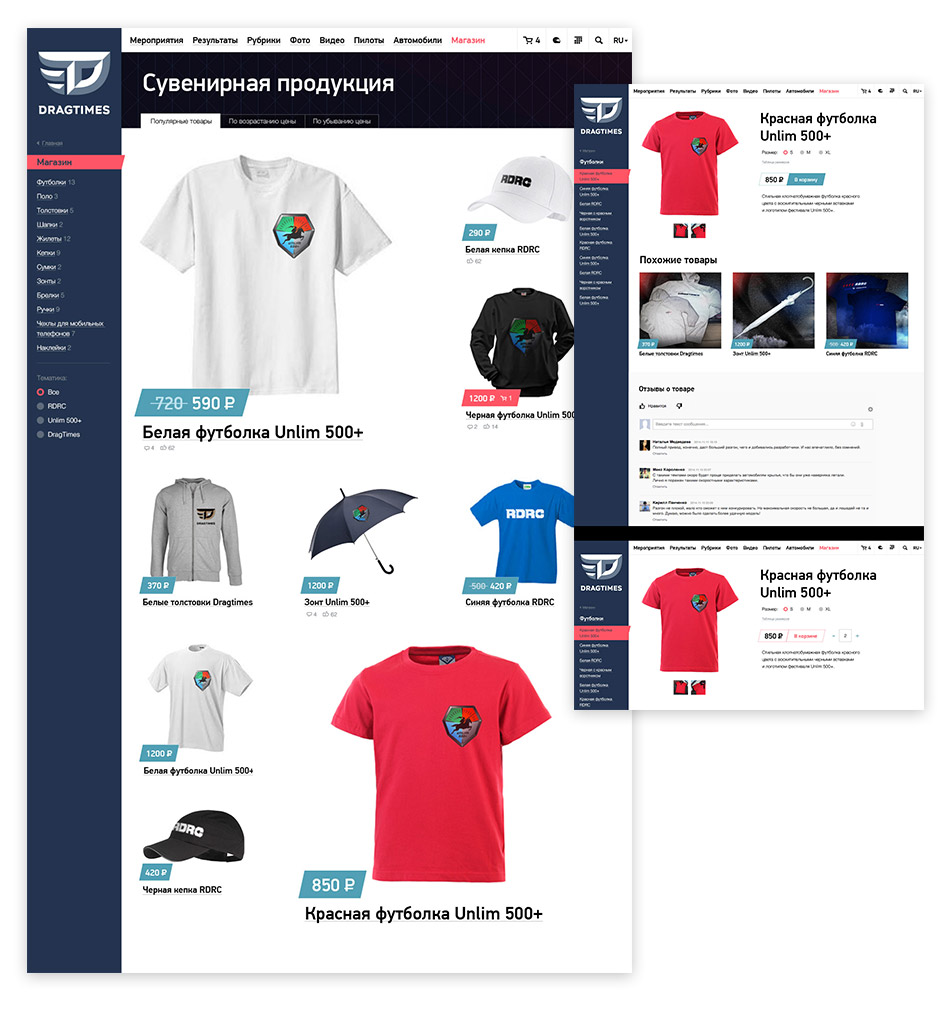
Art director: Boring. It should look exciting enough to make you want to buy something.
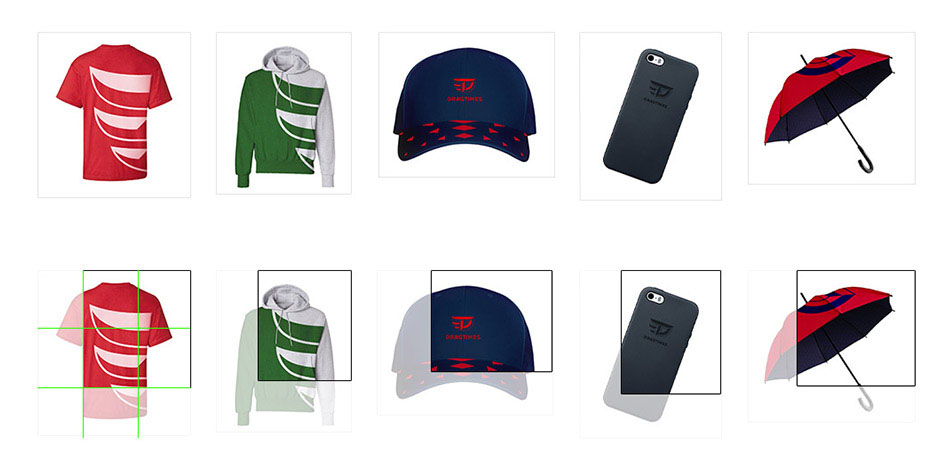
Designer: What if we take high resolution photos but only show parts of them? Then on each product page viewers will be able to look at the photos up close.
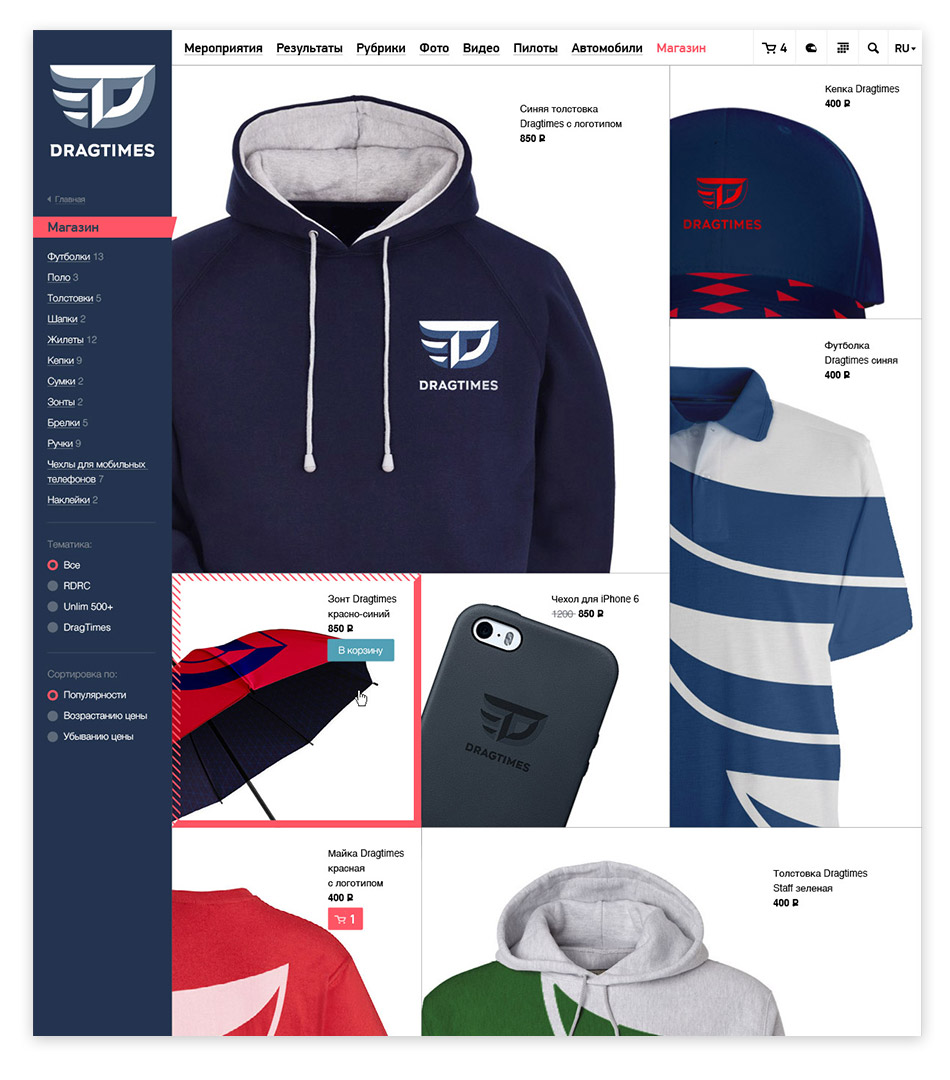
Art director: OK. We just need to decide on the presentation format so that the client can use it to take photos of the products.
Writing down requirements for photographs and showing to the client together with the mock-ups.
The client likes it. Preparing the online store for typesetting.
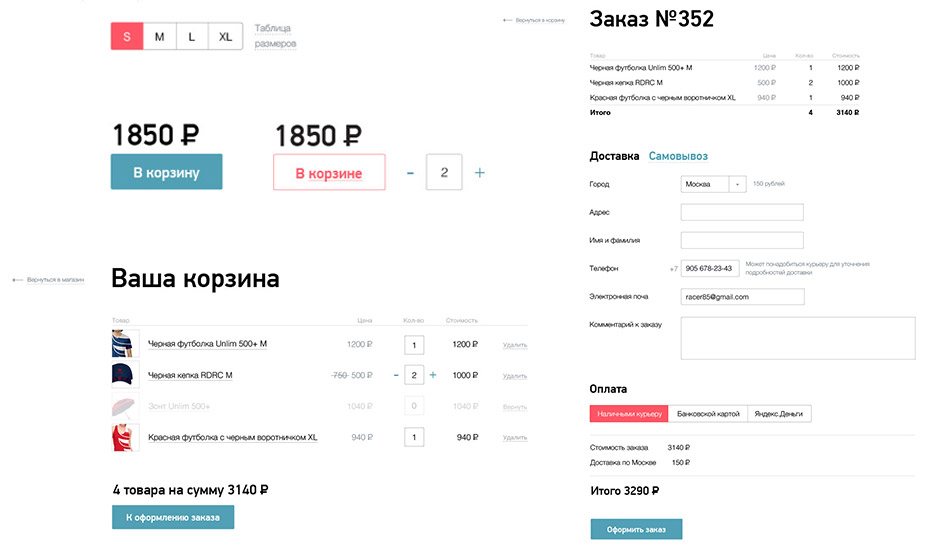

The driver’s account page will be based on the regular driver’s page.
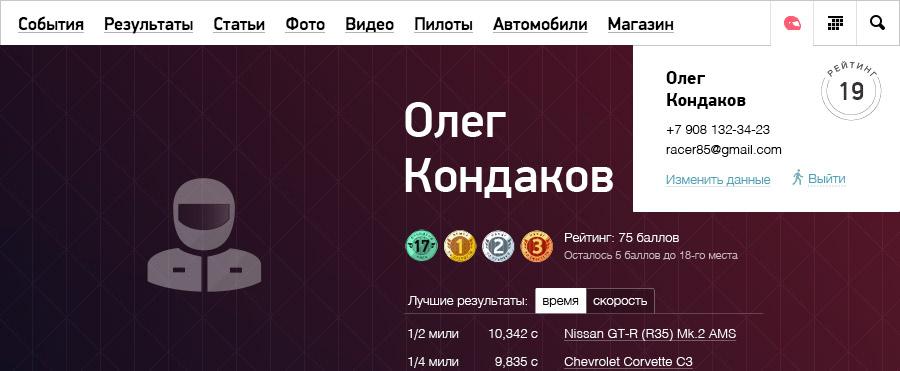
With each new achievement, drivers will get points that they can redeem in the online store. Creating a relevant promo block on the driver’s account page to reflect this.
Working with the Overview mode.
Creating the live search.

Fixing bugs and polishing the layouts.