Interface design for NT-MDT SPM images processing software
Scanning probe microscopyScanning probe microscopy (SPM) is one of modern powerful methods for investigating the form and local properties of a solid body surface. The resolution of the resulting images is at least 1000 times higher than that of the images acquired with the help of the best optical microscopes working in the ultraviolet band. Electronic microscopes have a similarly high resolution, but they are only applicable to conductors and semi-conductors in perfect vacuum and have a damaging effect on living cells.
A scanning probe microscope allows for acquiring a digital image of an atomic lattice, a living cell, an integration circuit, the structure of a polymer, the surface of a CD. The resulting images of the surface being investigated are in fact three-dimensional, as while scanning at each point of the sample its relative height or the value of one of physical properties are measured: mechanical properties (for example, with liquids), optical or electromagnetic properties. SPM is employed in physics, chemistry, material science, biology, medicine and high-tech production.
The scanning probe microscopes produced by |
Release date: June 03 2005 Cast: art director
interface developers and designers
Artem Gorbunov
Anna Kleymenova pictographer
Roma Voronezhsky
manager
Ekaterina Berezy
Art. Lebedev Studio would like to thank Stanislav Leesment for his help in project implementation All SPM images are the property of NT-MDT |
||||||||||||
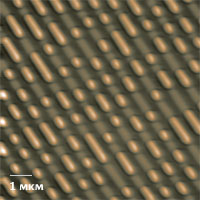
DVD stamper
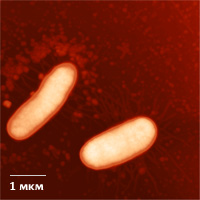
E-coli JM-109 enteric bacillus
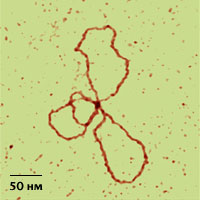
Supercoiled circular plasmide DNA (pEGFP, 3.4 kb. p.) on mica
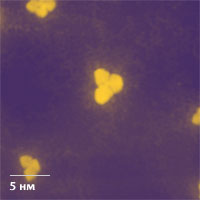
Monocrystals of urotropine + H2PtCl6
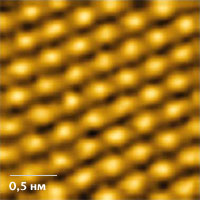
SPM atomic resolution on HOPG
Processing of SPM images Main window of the module
The scanned image has the largest possible vertical size owing to the movable toolbar and the general optimization of the work space. The toolbar contains frequently used tools for area selection and image transformation and analysis.  The sensitivity of the “magic wand” is smoothly adjusted using the scrollbar at any time, not just during selection On the Z axis scale the ends of the displayed range (triangles) and the entire selected range within the maximum range can be shifted (like a scrollbar). If necessary, you can open a supplementary histogram that’s positioned over a semi-transparent background so it can be left on screen.  The histogram over the semi-transparent background can be turned on and off
All transformations of the image are made using the toolbar or filters picked from the menu. The filters are used to align the plane of the image, reduce the noise, increase sharpness and solve special problems. All filters are placed on the image without changing the original scanning data. The entire chain of filters is visible, so it’s always clear what transformations and in what sequence have been made. It increases confidence in the results of the research and is part of scientific ethics.  Every filter has an icon depicting the parameters, the mask or the result of filter operation. To illustrate the rotation and mirror reflection, we used a square with an asymmetrical letter F (filter). The names of filters on the list also contain the values of parameters: for example, “rotate by −13°”, “Fit lines (order 2, horizontal)”
Order of filter application can be changed by drag-and-dropping, and every filter can be temporarily turned off. Every filter has a mask, i.e. the areas on which it has an effect. The parameters of the filter are adjusted in a separate window in the preview mode. |
 The adjustment of the “polynomial fit” filter which compensates for biases by deducting the approximating curve (of low-order, as a rule). The blue line is the section by which the fitting curve is automatically selected (it can also be edited visually). The green line is the control section. The result of filter operation can be assessed by changes in its slope
|
System warnings don’t interrupt the user’s work as they do in some other programs
Analysis of SPM imagesAfter the needed transformations, the adjustment and correction of the image have been performed, it’s time to investigate and analyze it. The program module provides tools for linear measurements and statistical and harmonic analysis. In the older version of the program as a result of using any tool, the work space was additionally split to free up space for a frame with results. So when the new frame appeared, the size of other frames would shrink. |
  “Section profile” tool in action. The markers can be shifted both along the section line and at the histogram with profile
|
|
To compare the images, the work space can be split into two or four windows. A special lock ( |
 Relief on the left, difference of phases on the right. The value is shown at a point above the cursor at the scales of both images
|
|
One of the statistical analysis tools is used for studying the distribution of micro-grains on the rough surface of an object. This tool recognizes micro-grains in view of the threshold value set by the user.  Every grain is stored in a table. In the table the grains are grouped by intervals of square, volume, depth or some other parameter selected by the user. The number of grains in every group of the table is displayed in the histogram. The selected grains or their groups are highlighted in the image, the table and the histogram
|
 If the “width” of the bars of the histogram set by the user is big enough, then the value of “height” is displayed next to each bar
|
Report editorSPM images and related analytic frames are not only a means of scientific study, but also its practical result that can be presented as a scientific publication. For this purpose, the program module has an inbuilt report editor allowing for creating PDF and Microsoft Office documents.  Images and frames with data can be included in the report. Their look is automatically adapted for paper format.  Optimization of a frame with a section profile for print. Instead of reference axes, a scale is displayed on the image. Triangular markers on the graph turn into small circles 2 points in diameter and with 0.4-point thick outline. The data on the markers is displayed in a table
The report editor is based on the principle of a modular grid. Type area of the page consists of grid cells grouped in rows and columns. Objects containing images, graphs or texts from frames are “pulled over” the cells, when each object can take up a rectangle formed by a whole number of cells. The results of a scientific research rarely look so neat and beautiful. |
IconsImage processing tools look as usual—exactly the way they were drawn for the first time 20 years ago. PalettesFor SPM data visualization, the program has a set of palettes. Some of them are designed to solve actual analytical problems, while others are intended for presentation only: 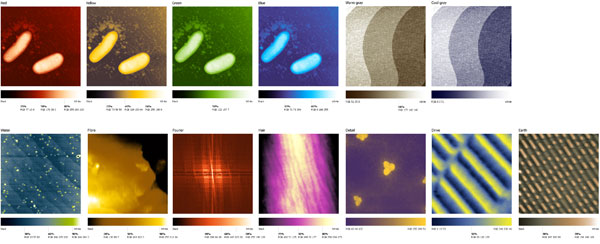 ProjectRussia-based NT-MDT supplies high-quality probe nanolaboratories, scanning probe microscopes, related accessories and software products. In 2004 Art. Lebedev Studio started developing a user interface of probe microscopes control and data analysis software products NT-MDT was working on. The SPM images processing and analysis module is the first of these products. |
