The making of the Gazprom Energo branch maps
Overview Process
Getting regional maps from the client as well as information on each branch: lists of activities, cities, areas, performance.
Evaluating the scope of work, marking the involved areas. It turns out, in some cases there can be a vast territory with few service facilities. Starting to search for the style of the maps.
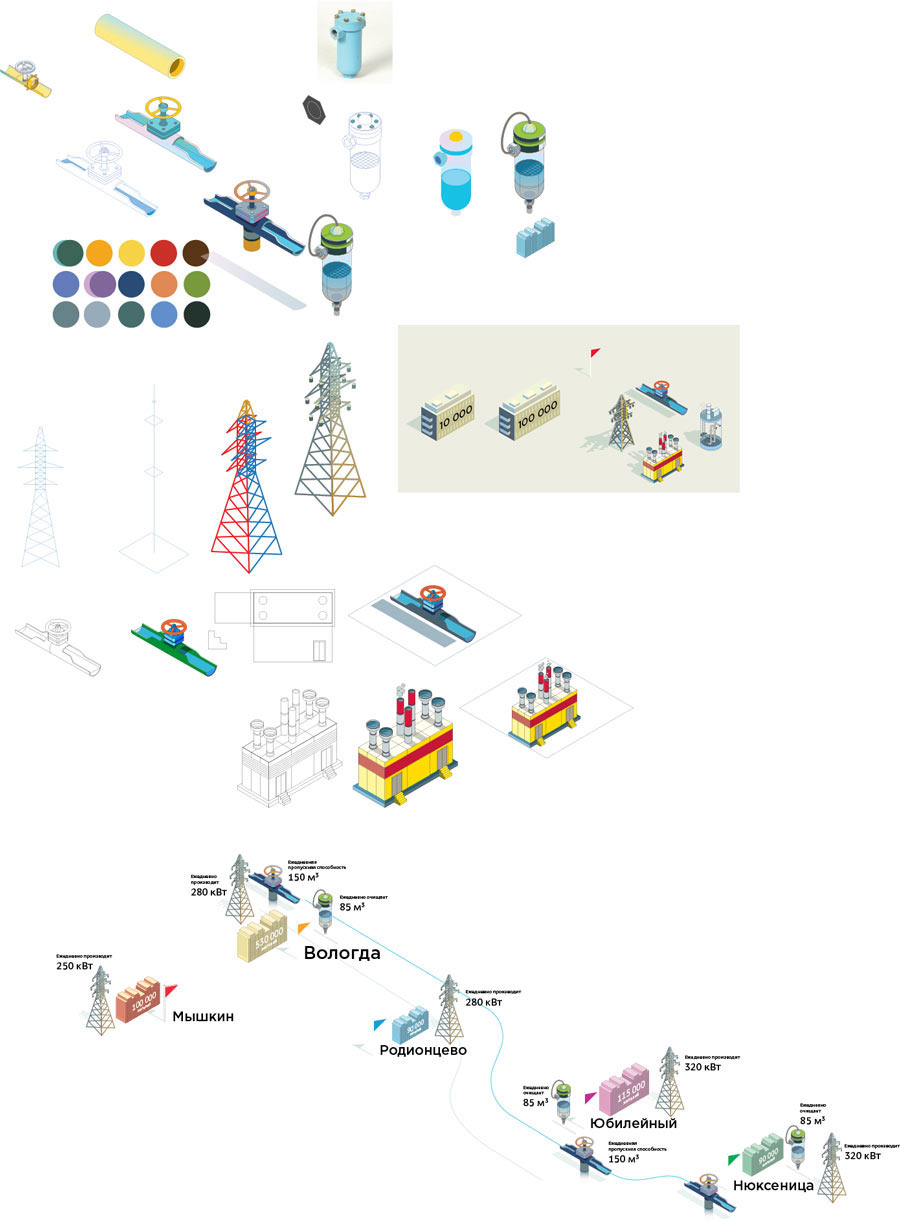
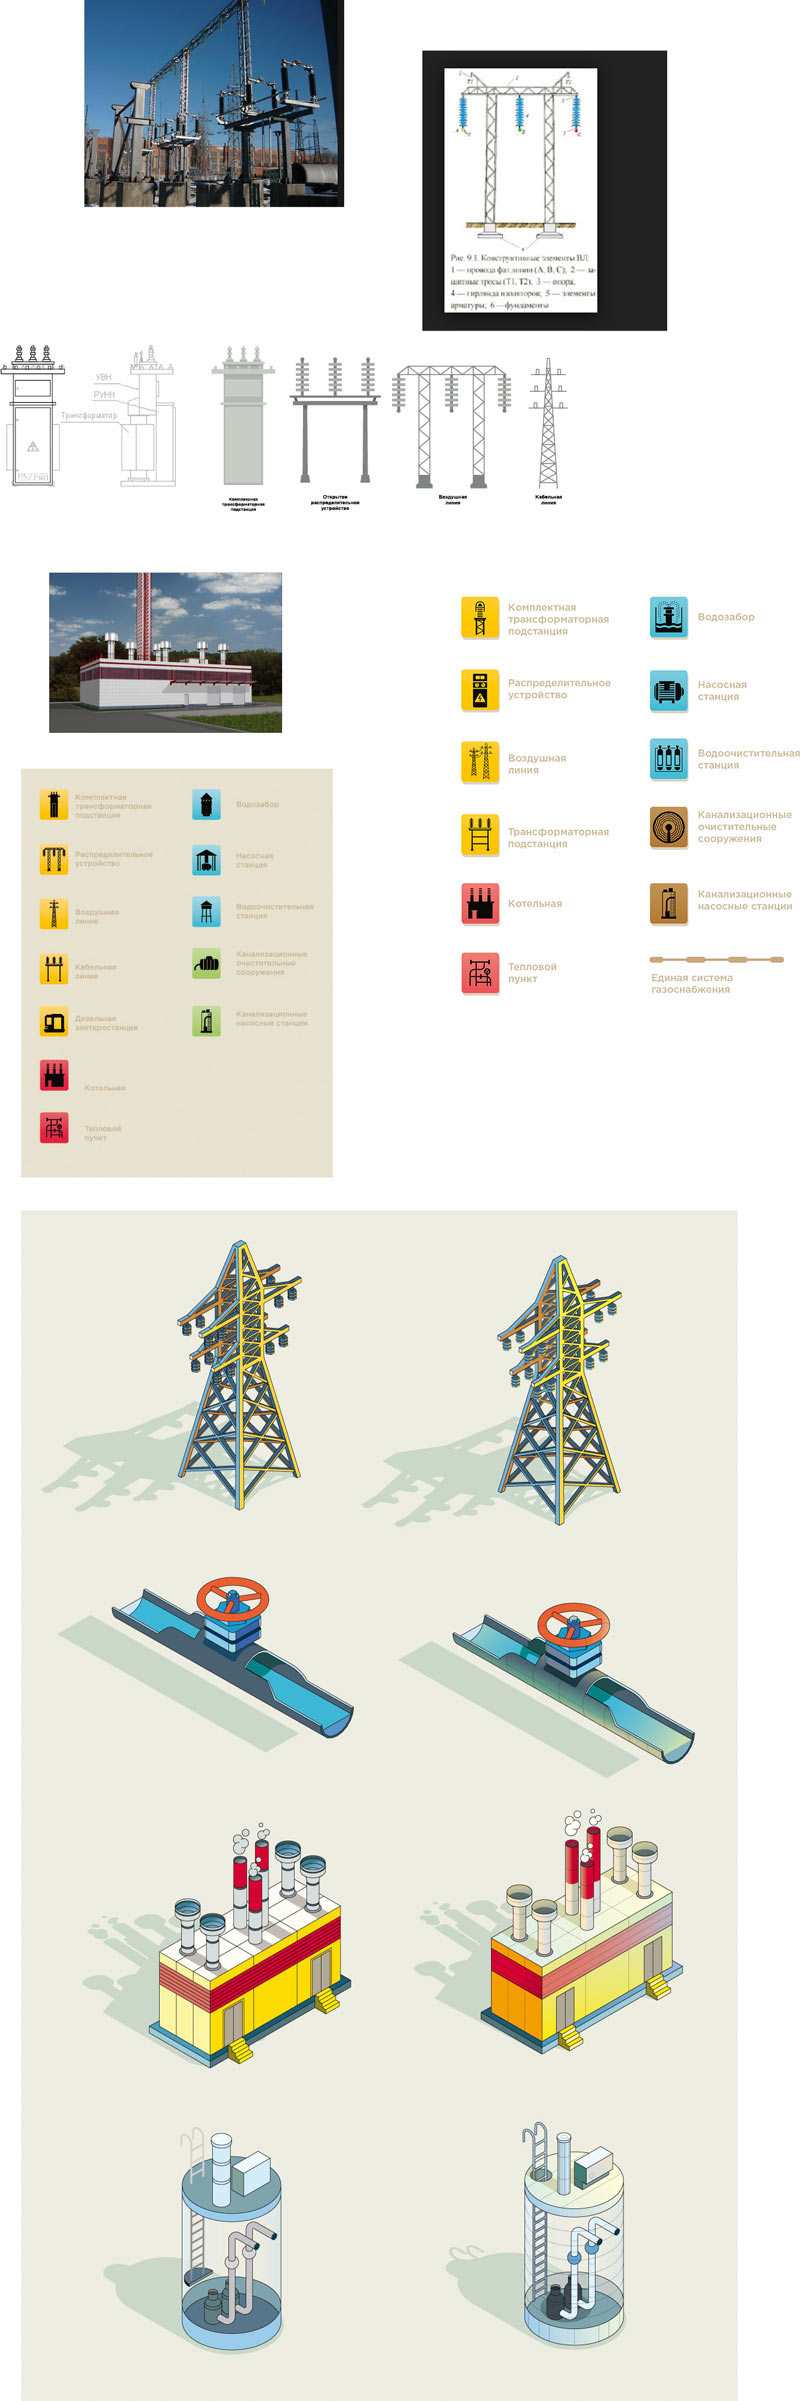
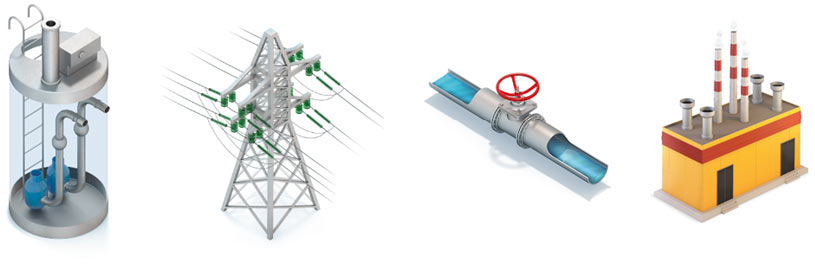
The illustrator sends in pictograms of branch activities. Trying them on a map.
It looks cartoonish, the density will be unpredictable and given the width of 1,5 m (5′) nobody will want to carefully examine such a map. What if we add some pseudo volume?
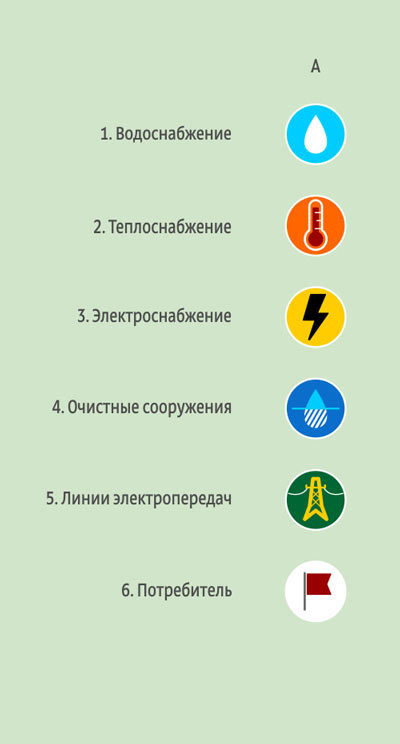
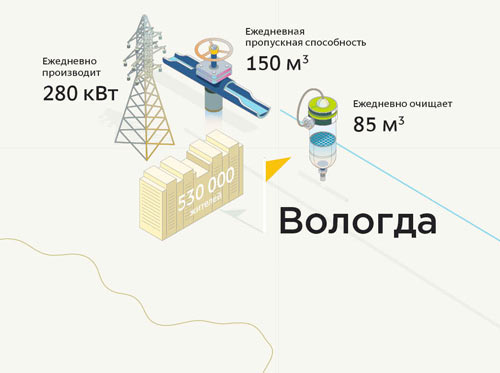
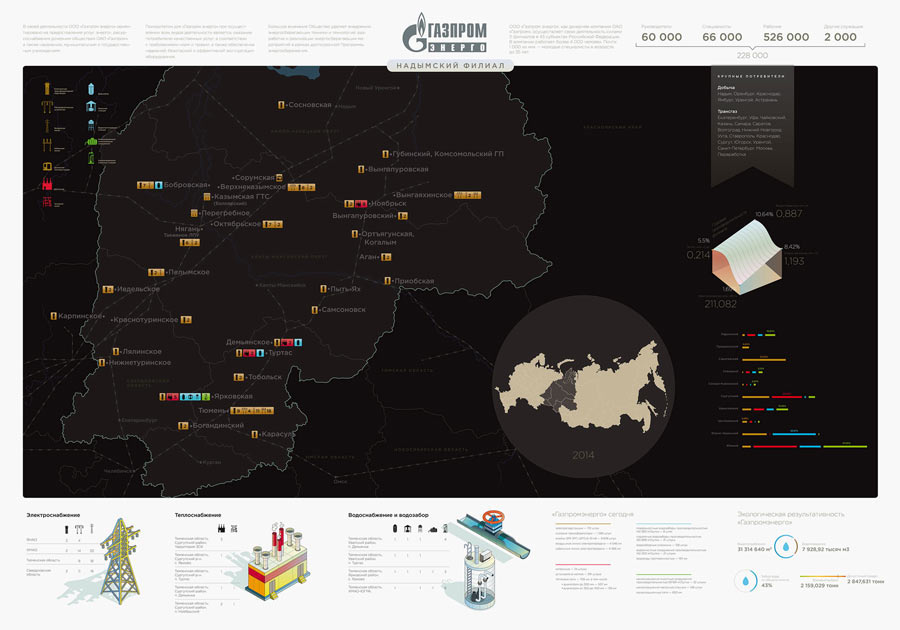
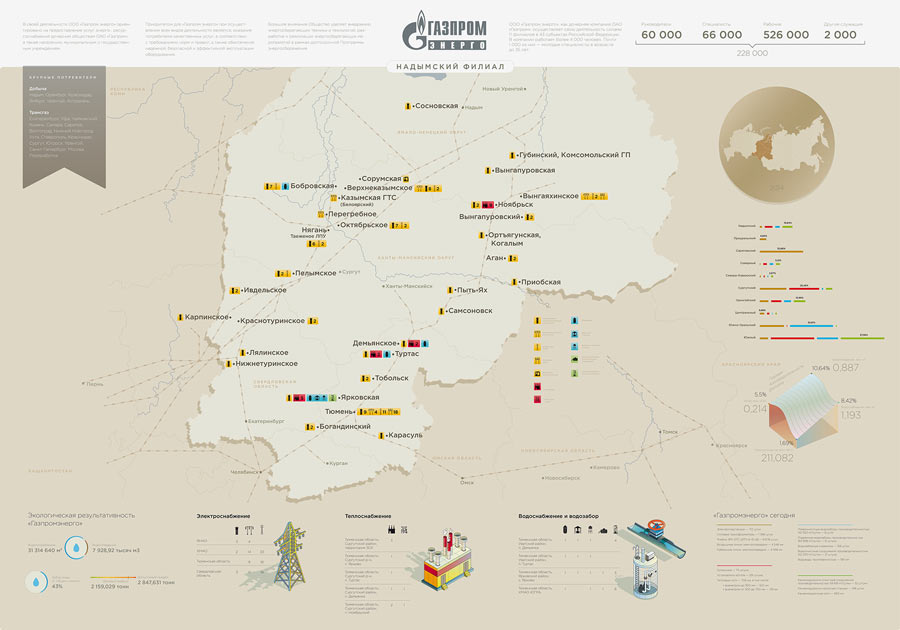
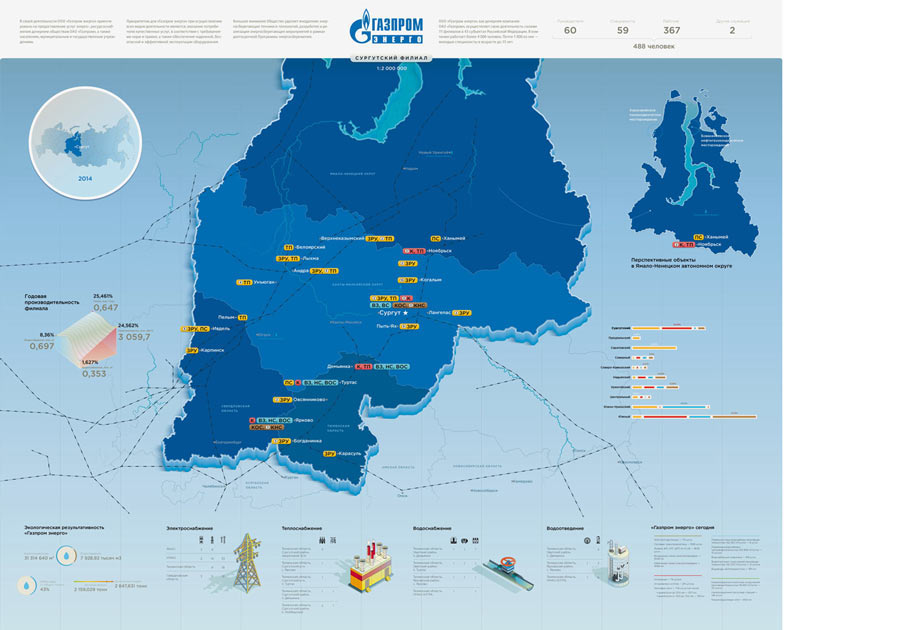
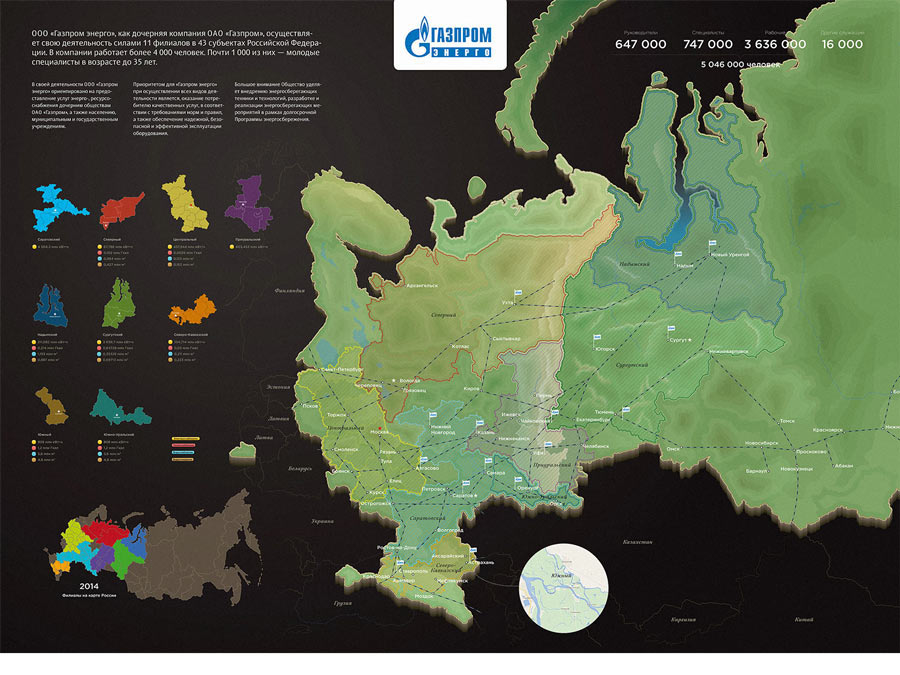
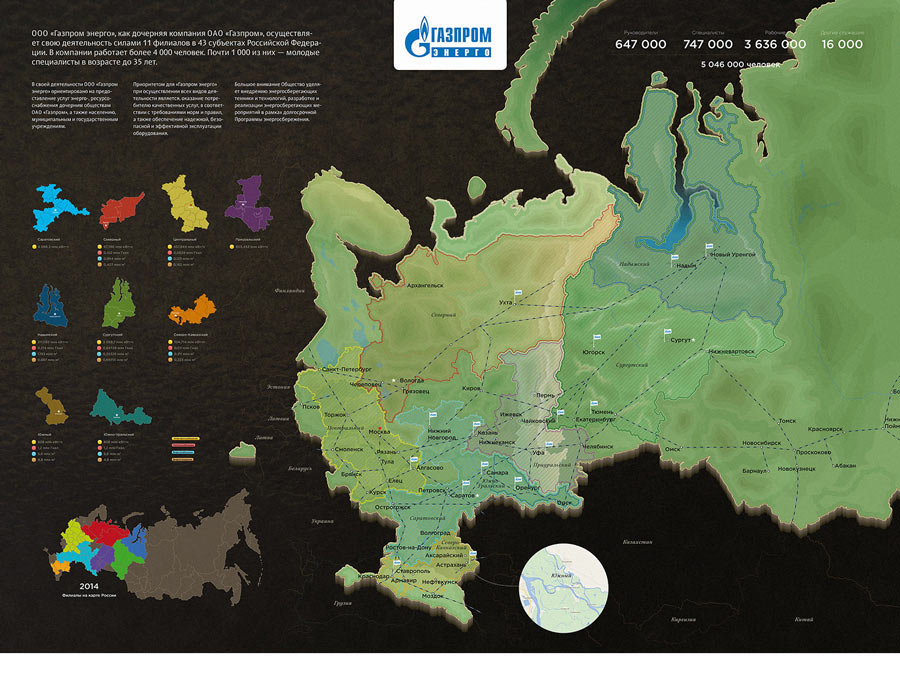
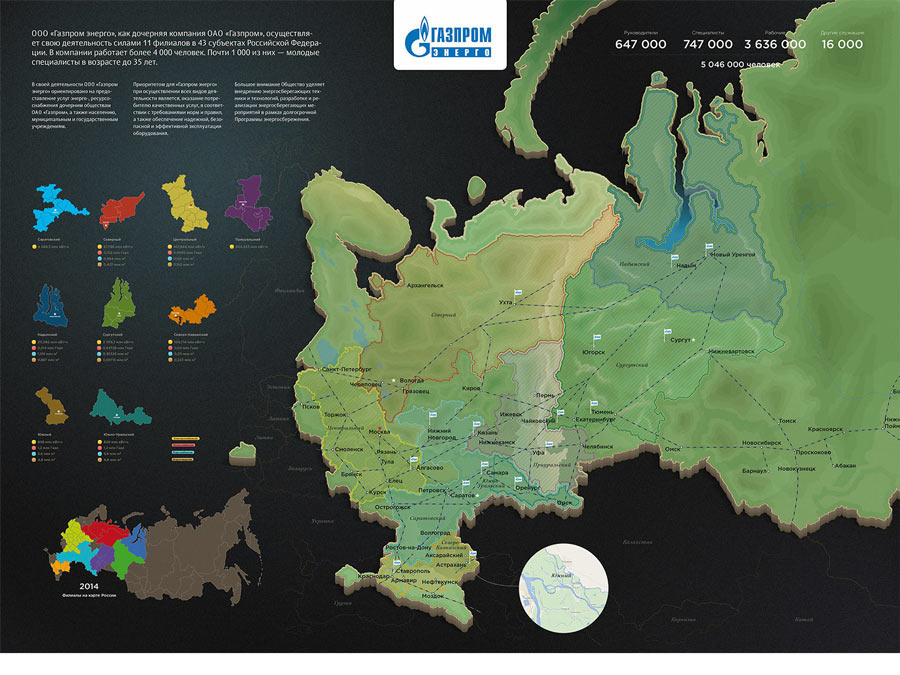
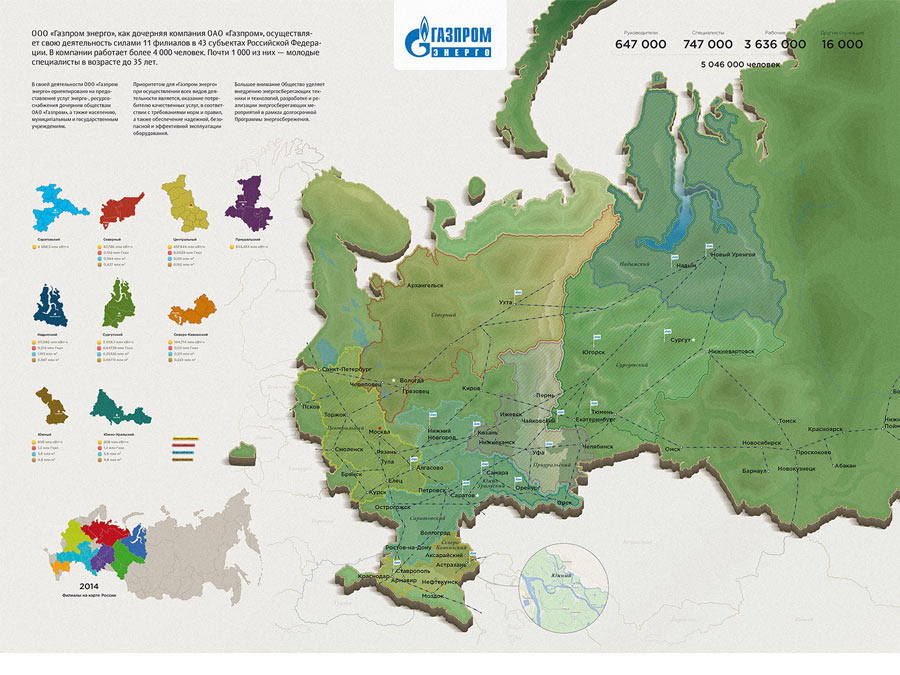
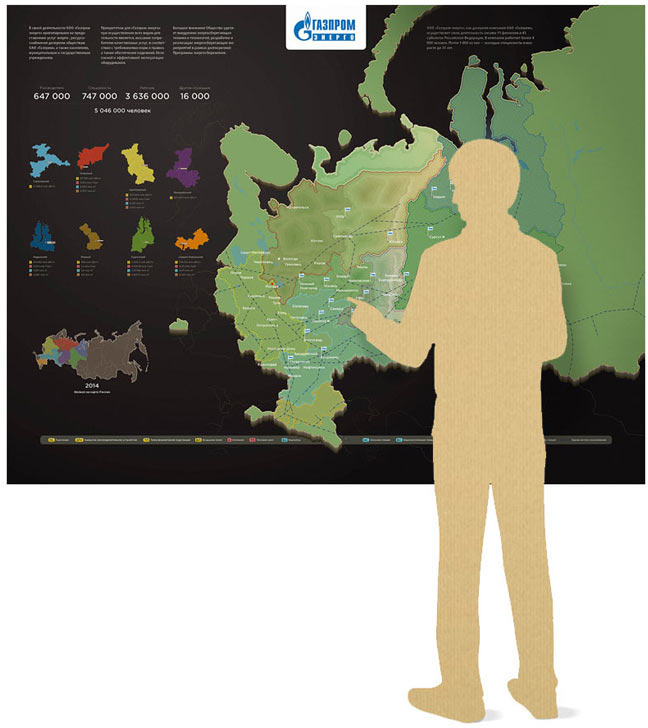
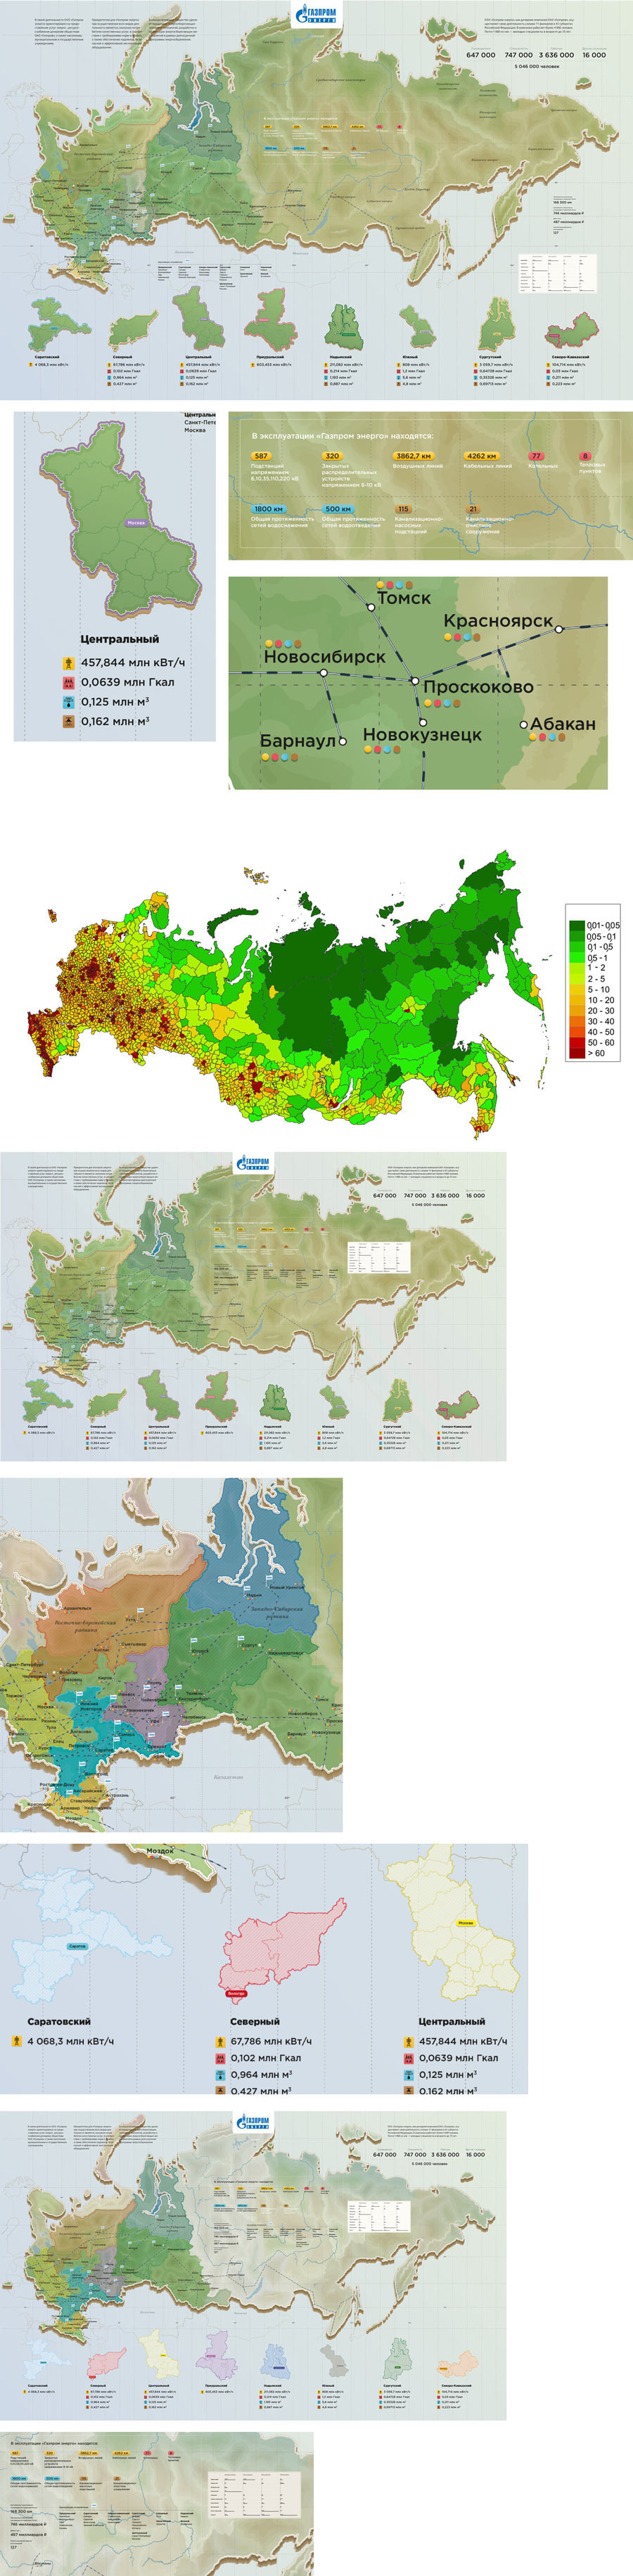
It’s time to stop, take a breath and think for a bit. The aim is to provide branch employees with a map of their own. On it they should see the territorial coverage, quantitative data for each locality, statistics and performance ranking among other branches. They should be able to easily understand what activities prevail (electricity, water, heat, sanitation) and where they are concentrated. All the detailed information will be in the legend. Which means we don’t need a detailed physical map. We only need to show a group of regions where the branch’s activity is concentrated and the rest is secondary information. Since the map itself doesn’t contain much data, it would be good to include some “tasty” graphics. A volumetric map seems to be better at this. Let’s add some volumetric icons to estimate the overall density.
Typesetting them into the map.
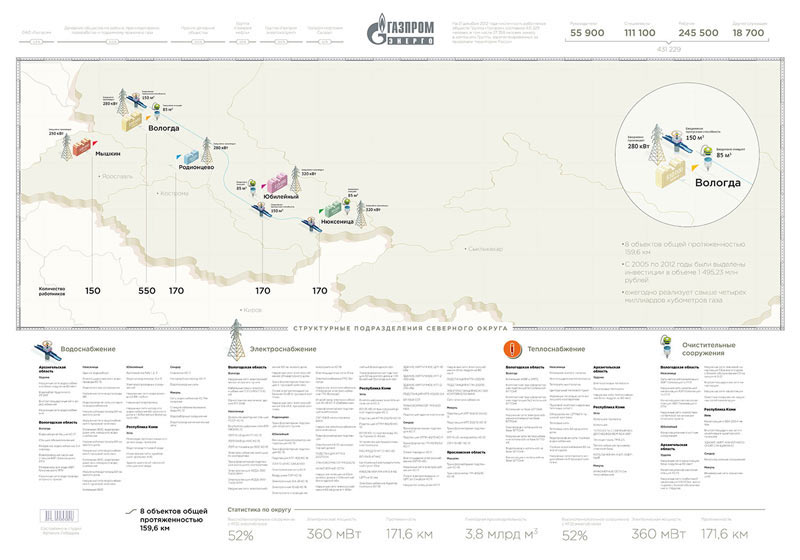
The map starts to include all the right information while we start to understand which elements are important.
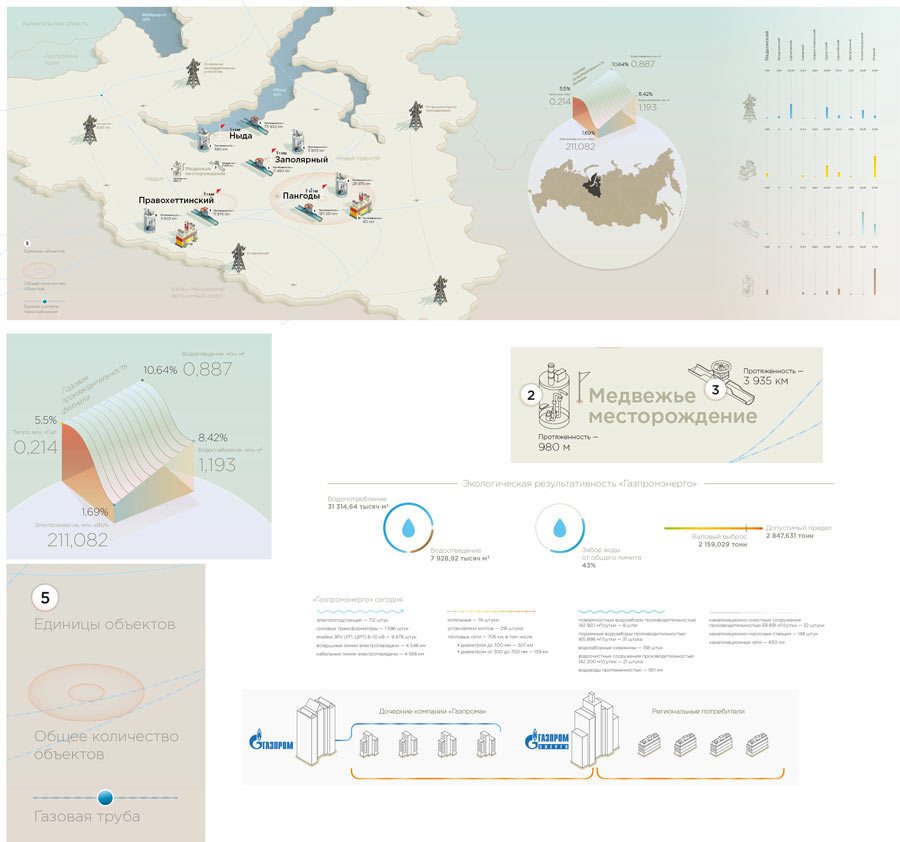
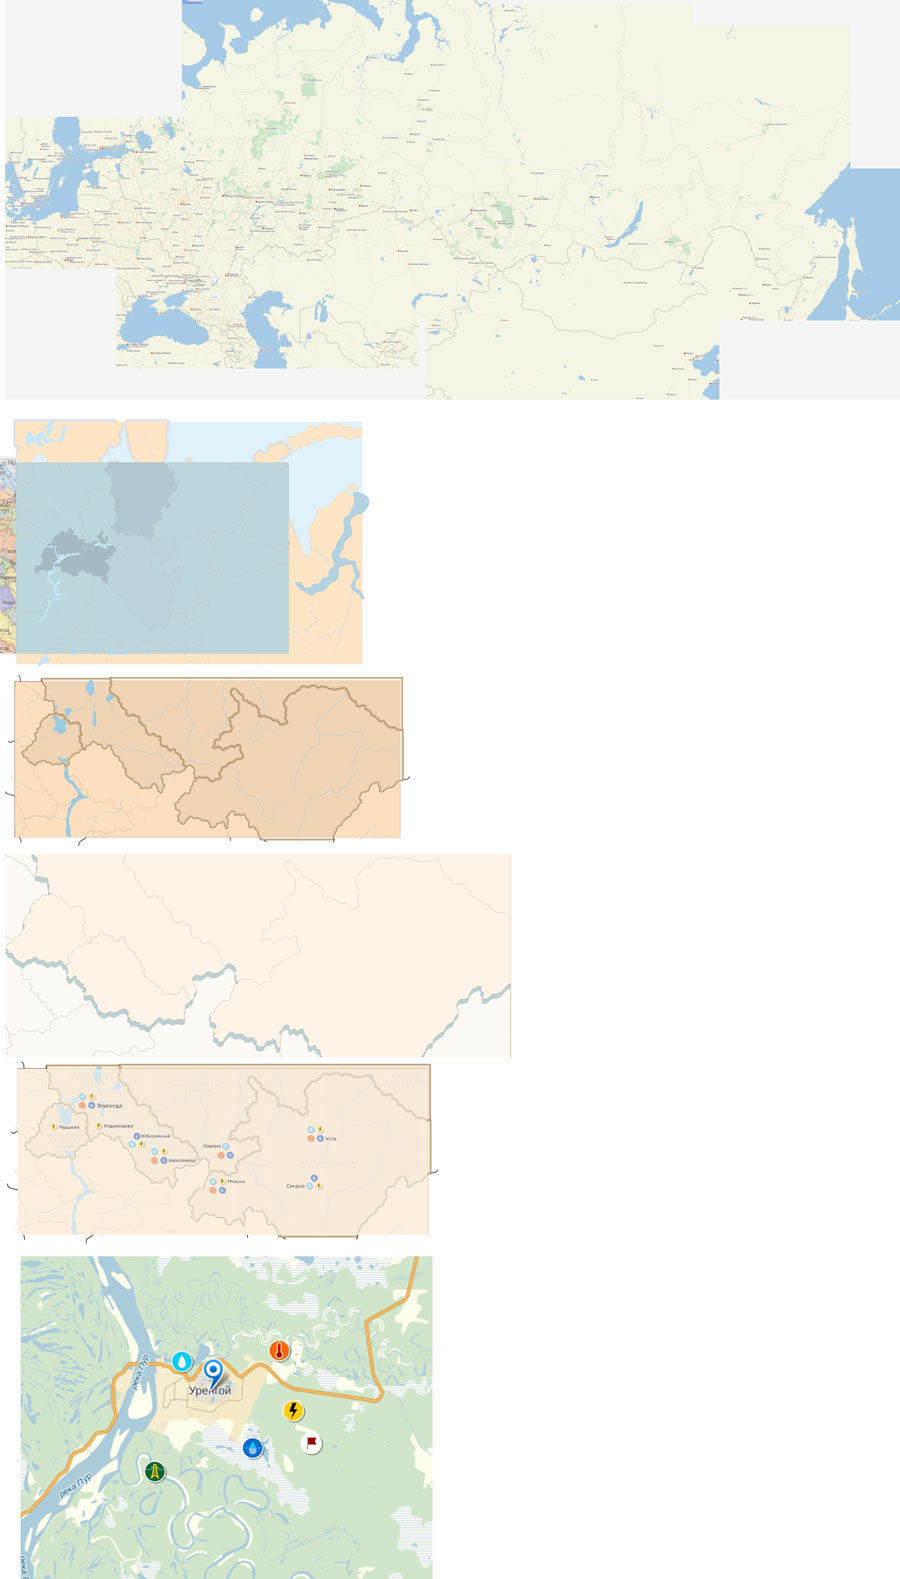
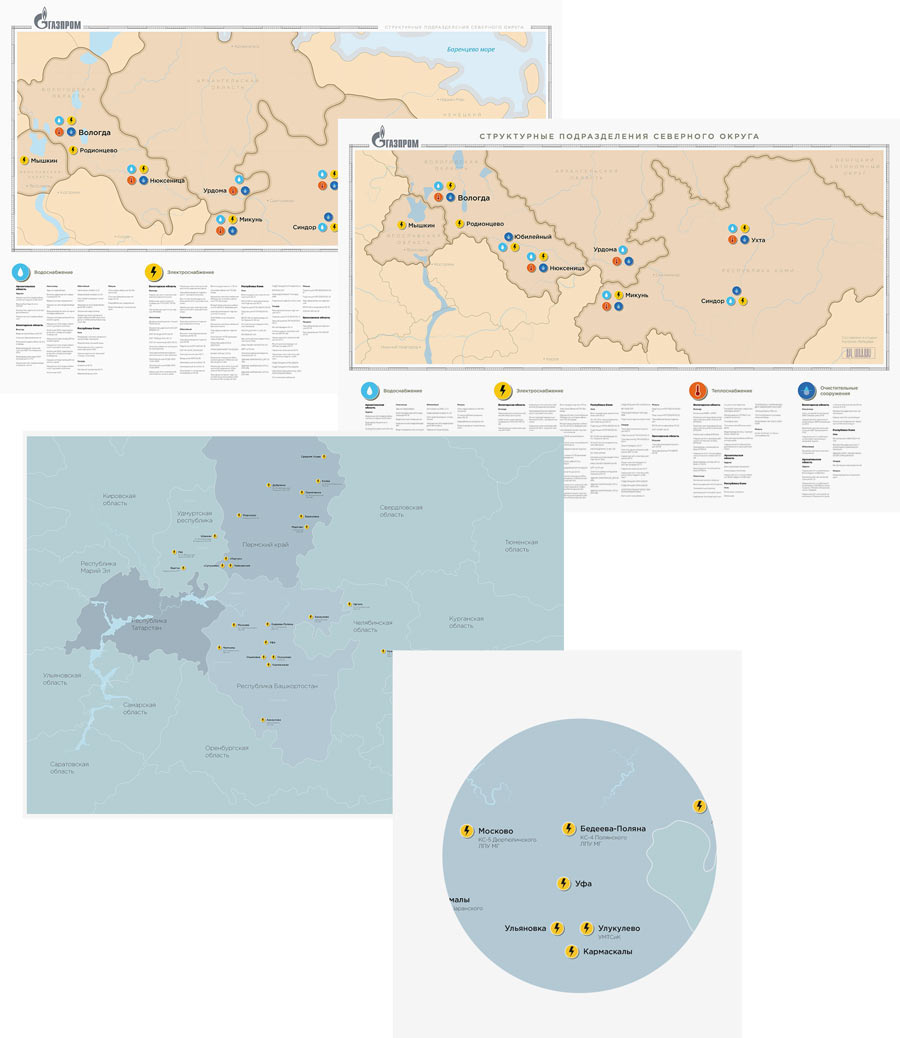
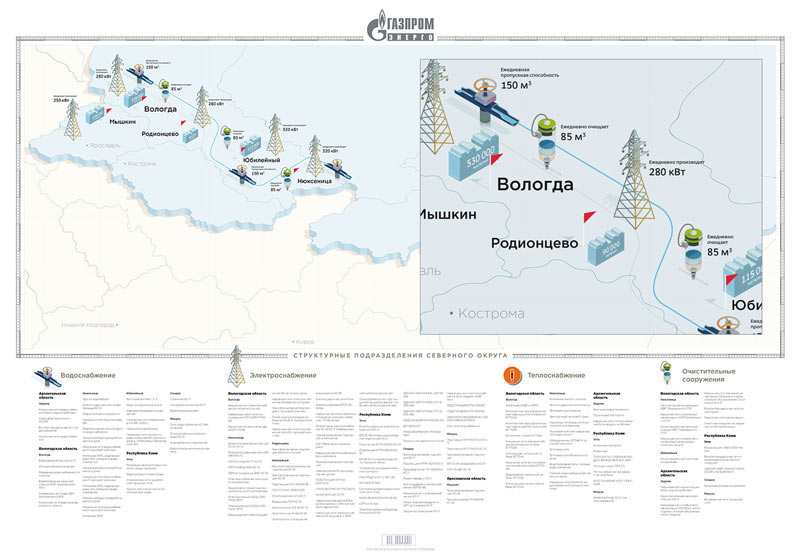
Showing to the client and getting feedback. First of all, the gas pipeline must be present, although at the background. They also want to provide detailed information about each activity: for example, electric power supply would include transformer substations, switchgears, power lines. Some branches have all of these components, others don’t.
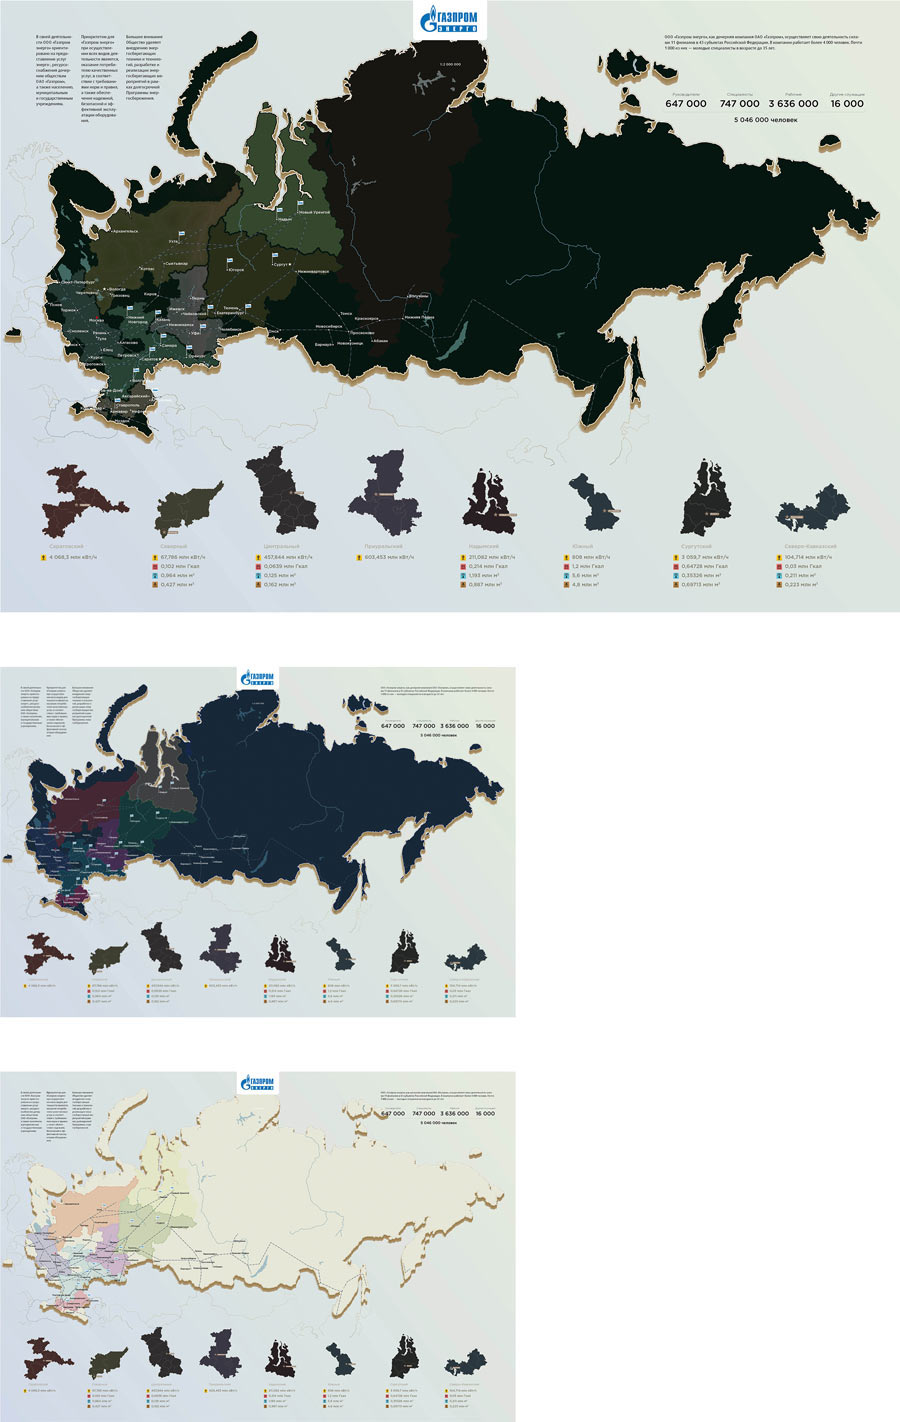
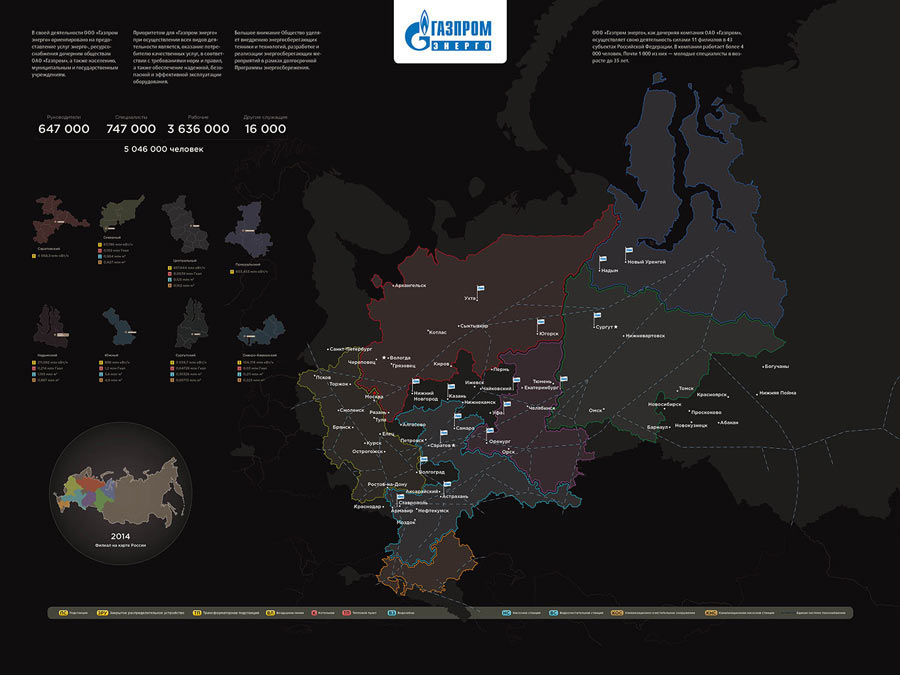
Besides the branches we also need a general map of Russia. Time to start working on it. Understanding the pipeline map sent by the client, mapping main reference points and trying to show Russia in the style we developed. The art director suggests to try a black map to make it stand out among the branch maps.
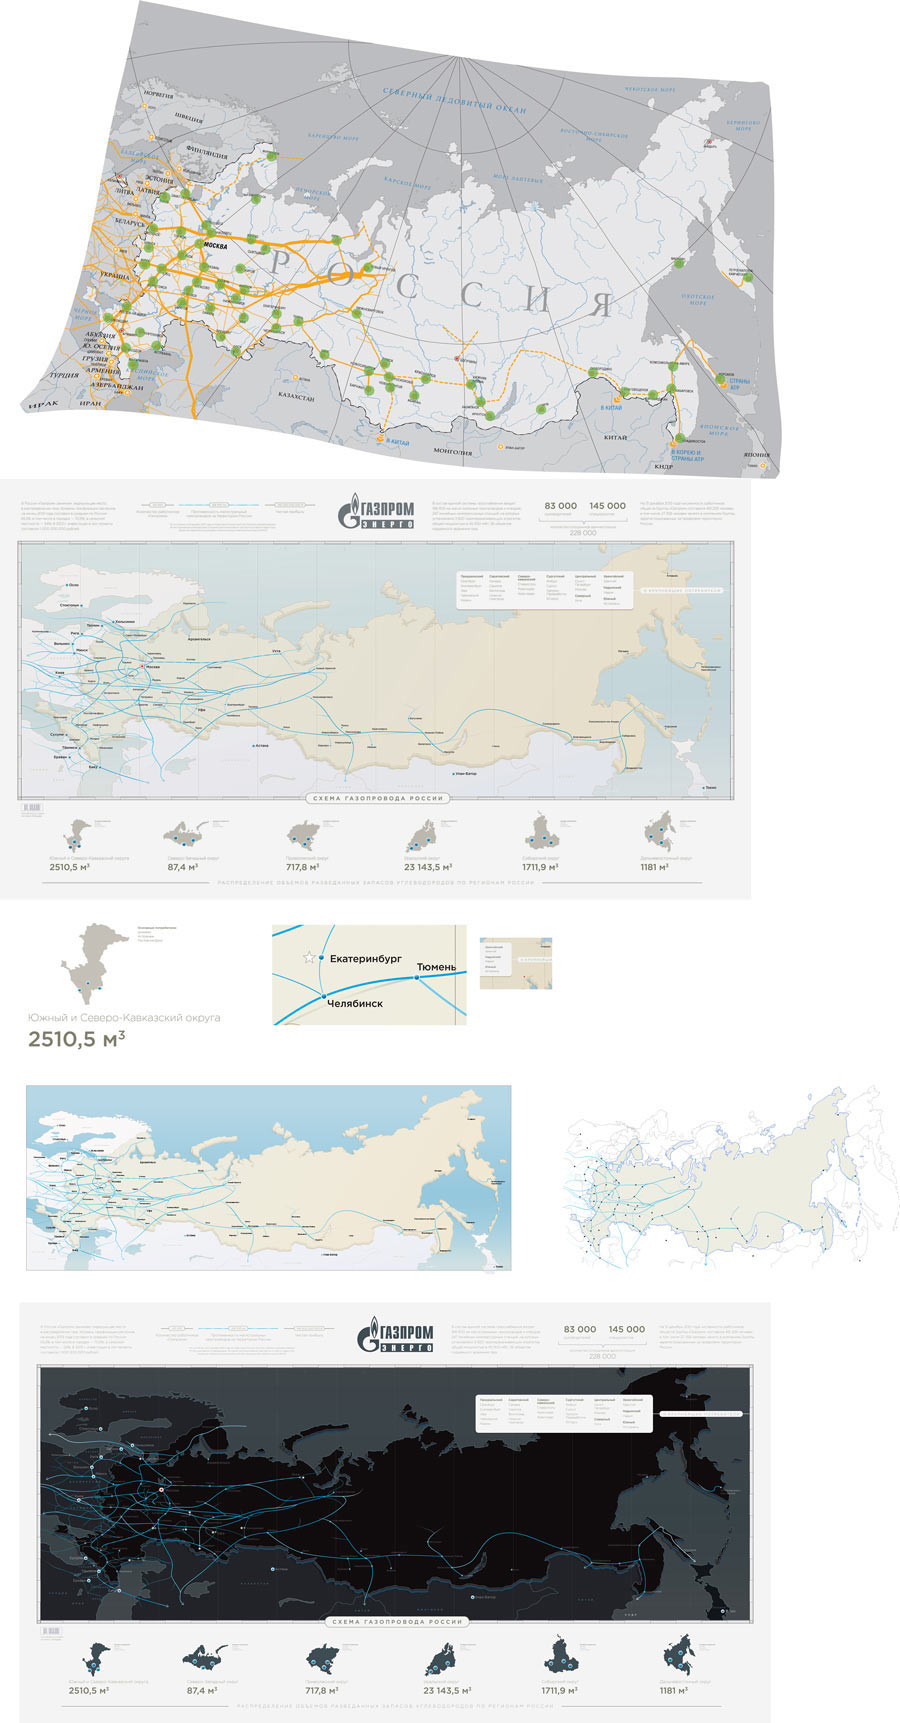
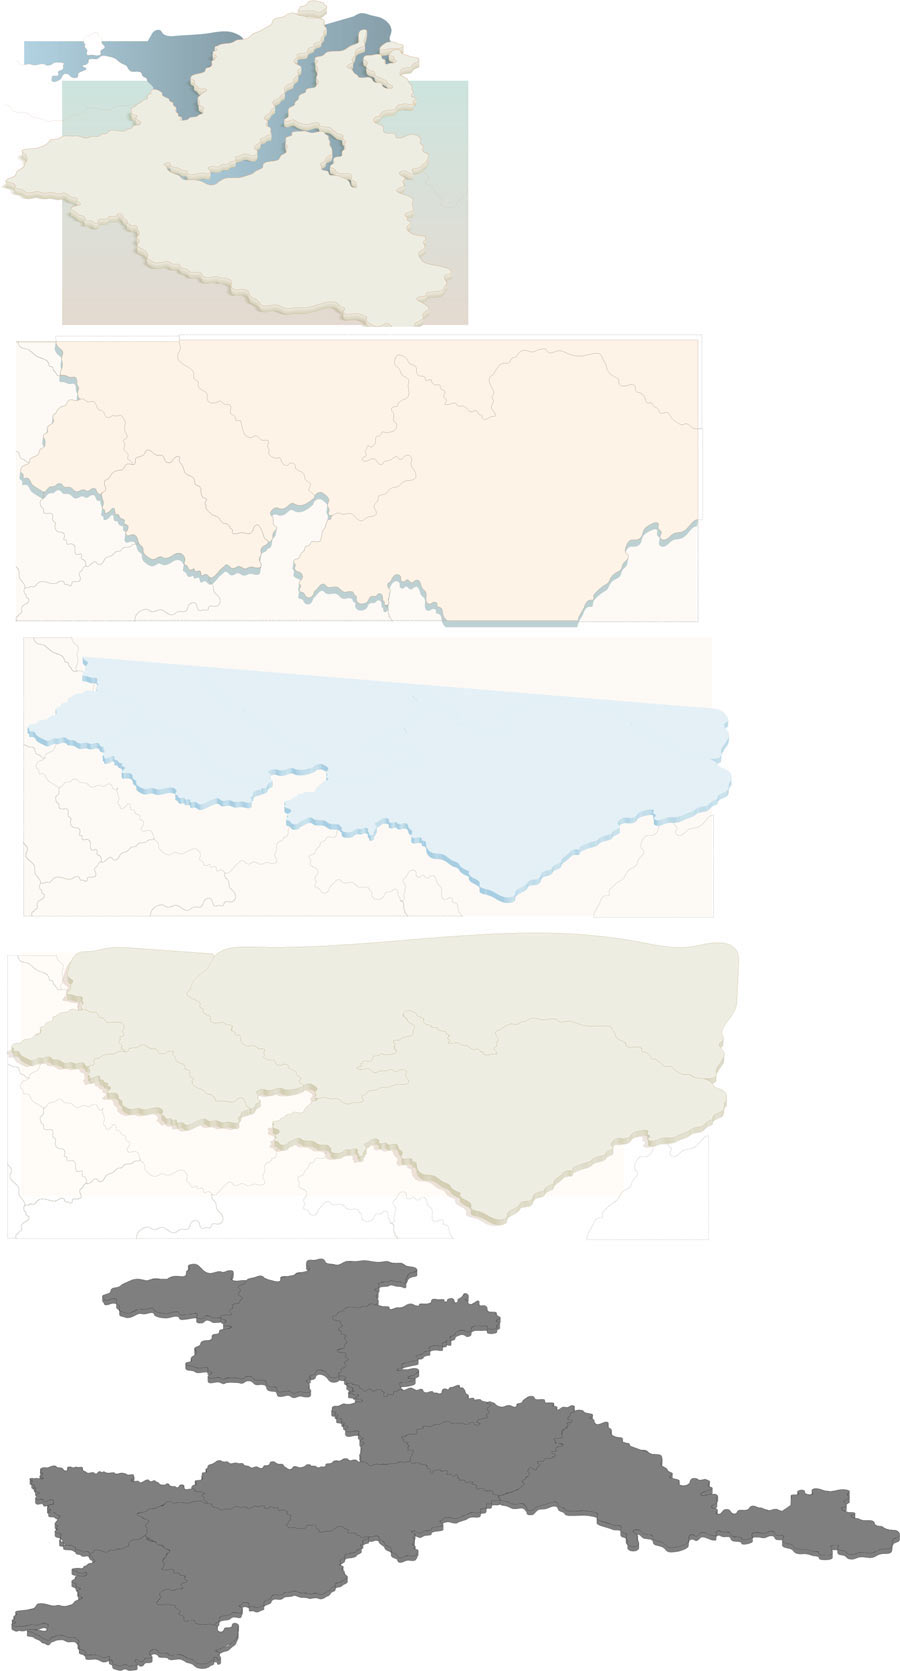
The black map is OK, but now the volume doesn’t look good, it seems more like a show off now. Also, the density is a problem since the map of Russia will be about 2,4 m (8′) wide. What if we make it flat?
Or volumetric and black.
Going back to the activities. Simultaneously working on the rest of the icons.
Spending more time searching for the style of the maps.
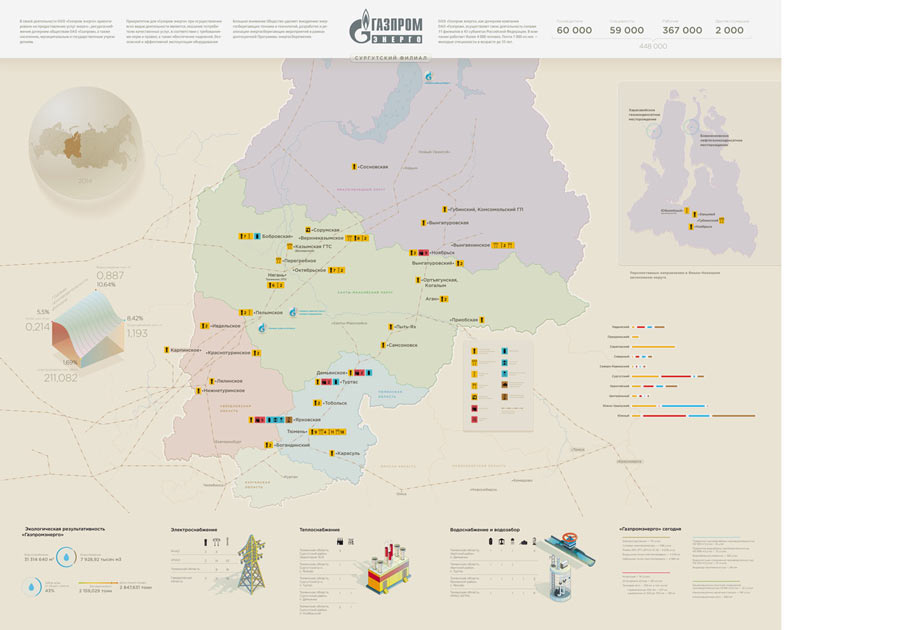
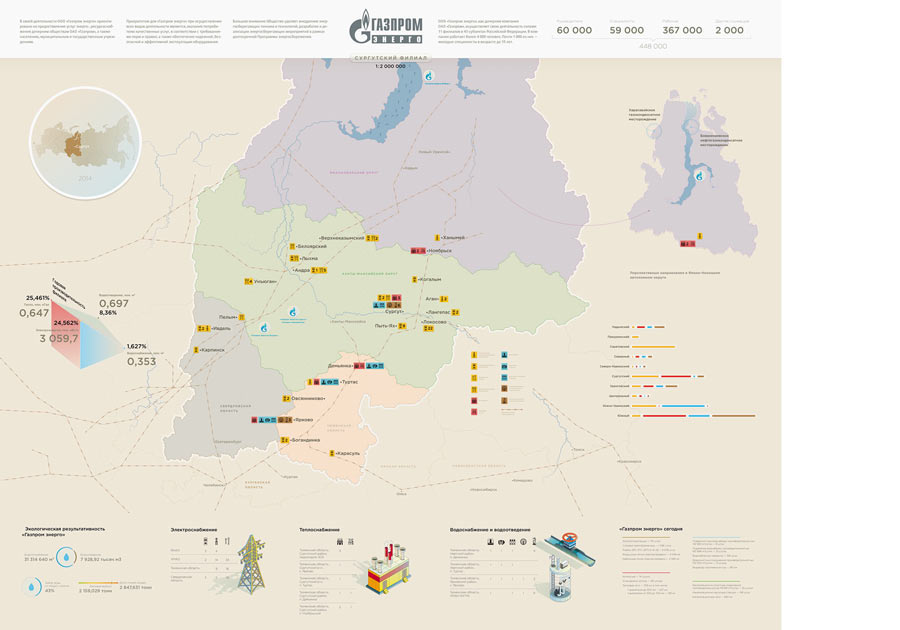
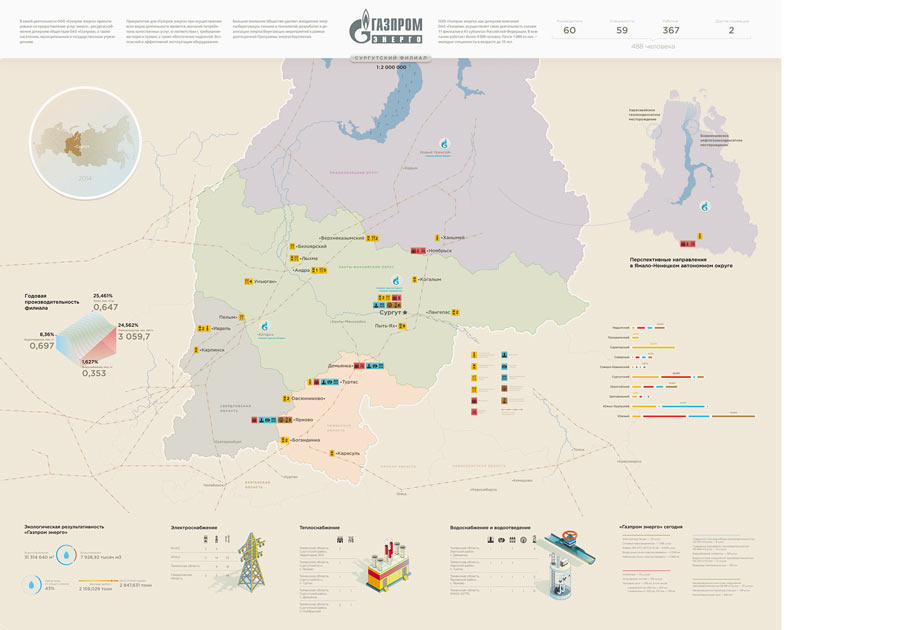
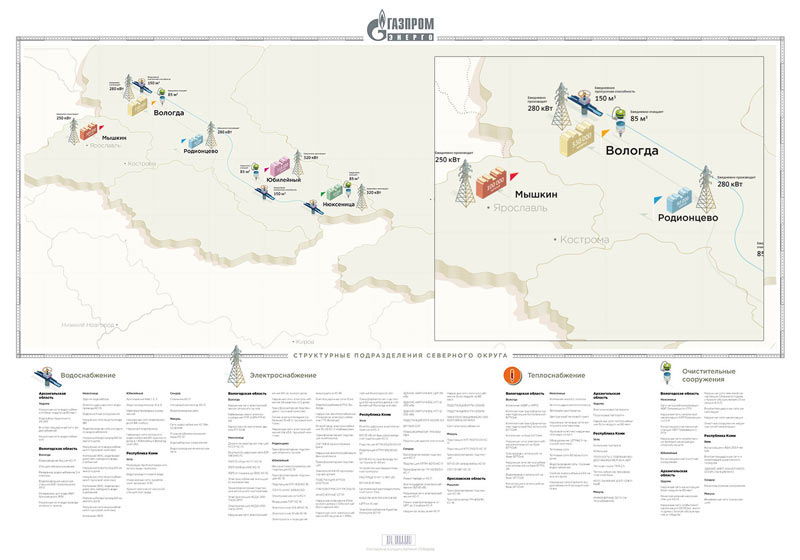
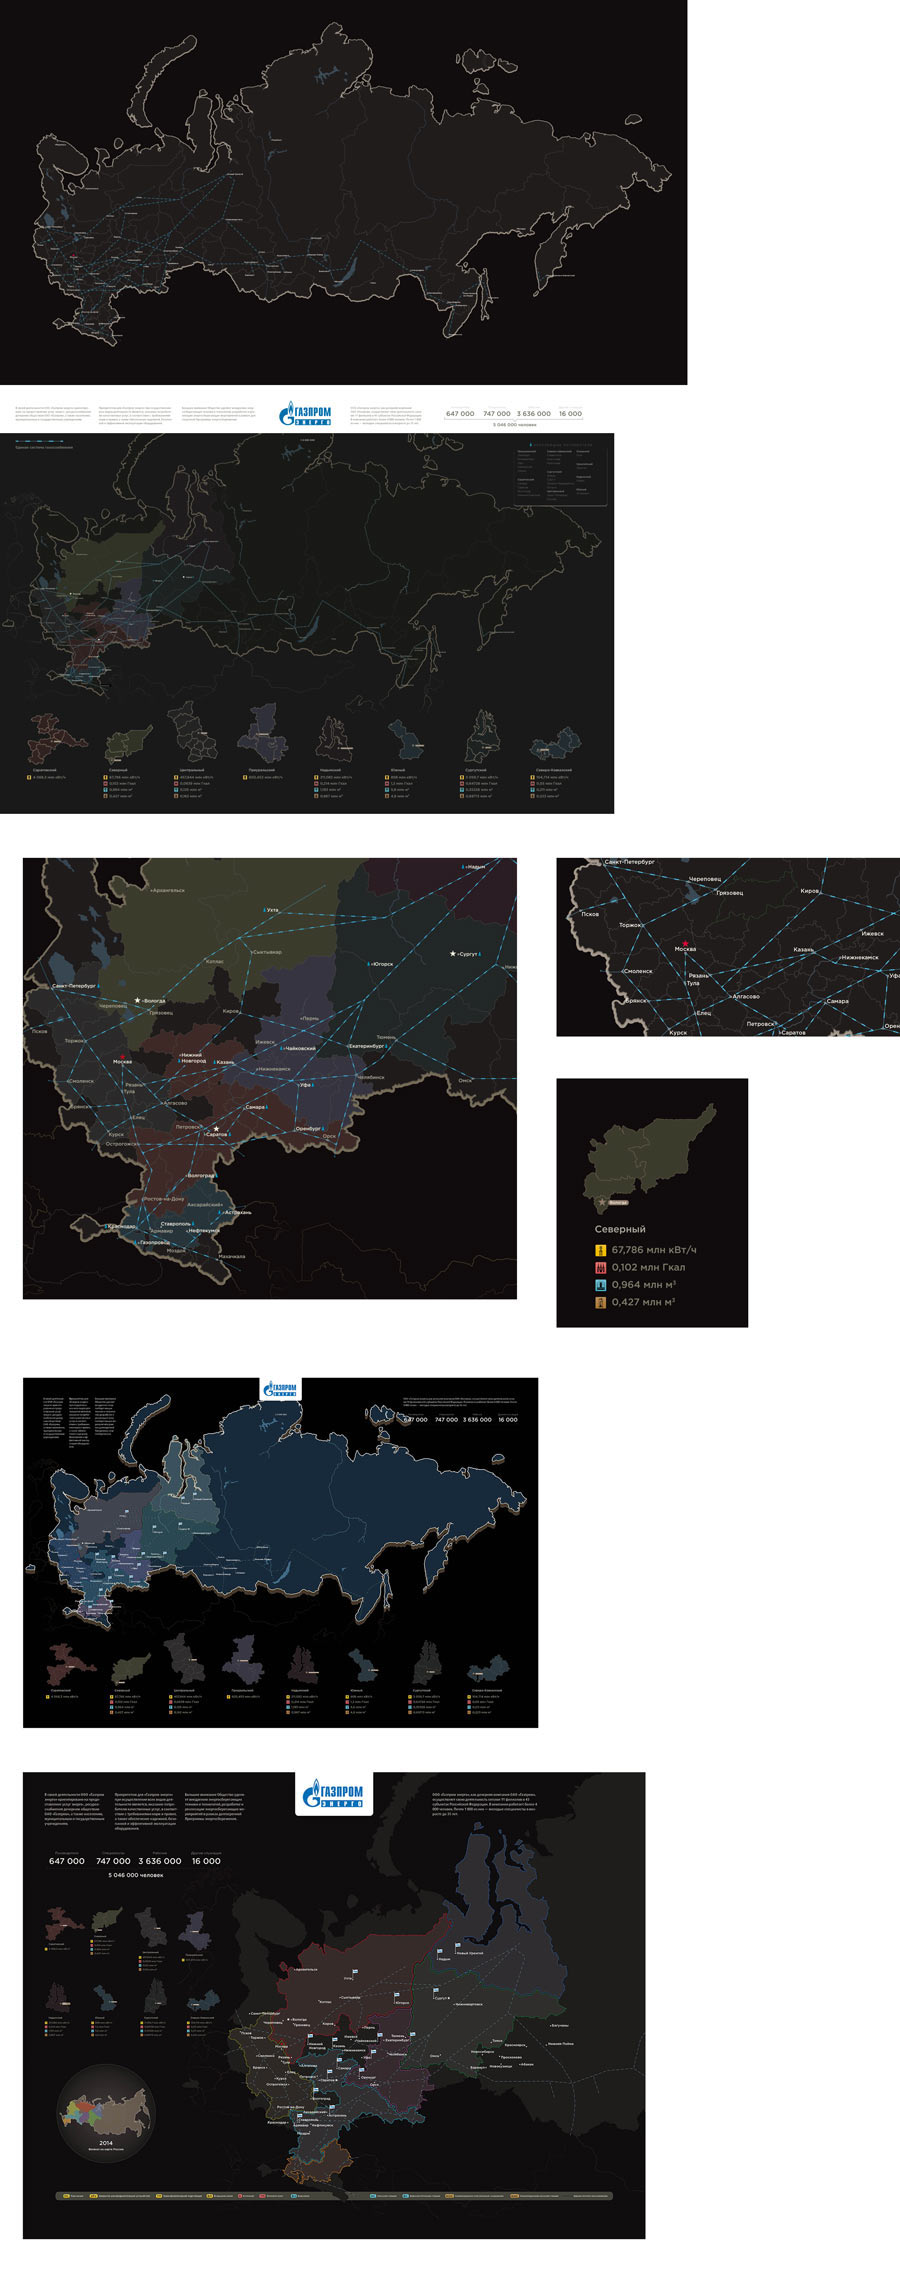
The artistic director comes by to say it all sucks. Trying to make it unsuck. In large scale the map still looks too plain, since it doesn’t feature much of geography. We need something to catch the attention, an interesting texture. Especially in the case of the map of Russia. Discussing it with the art director and coming to the conclusion that by showing a large empty space in the right part of Russia together with an information overdose in the left we somewhat contradict the task. We make it look like Gazprom Energo has poor coverage, even though the real reason is difference in population density. Trying to introduce some features of a physical map, like different colors and textures.
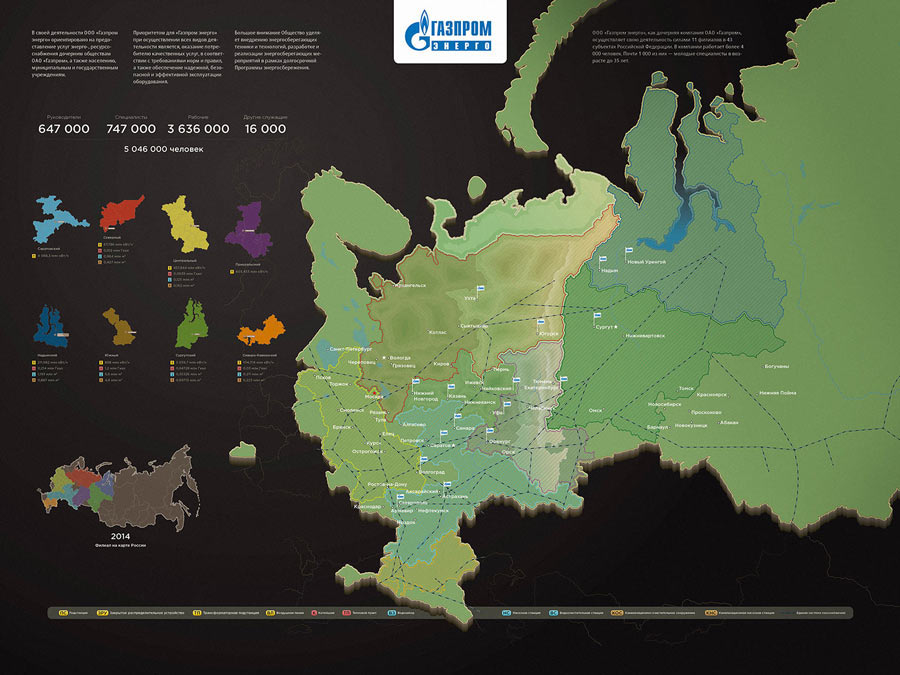
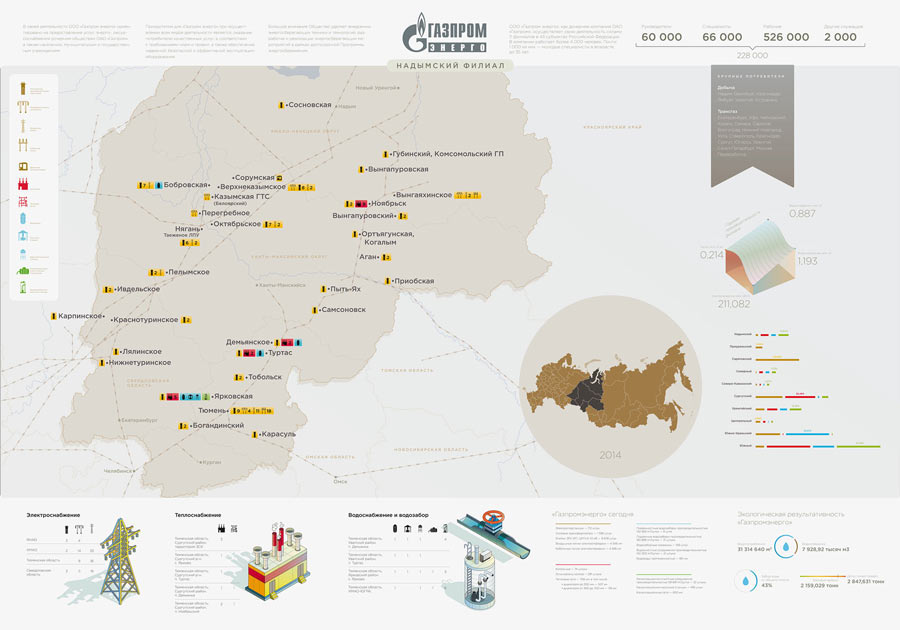
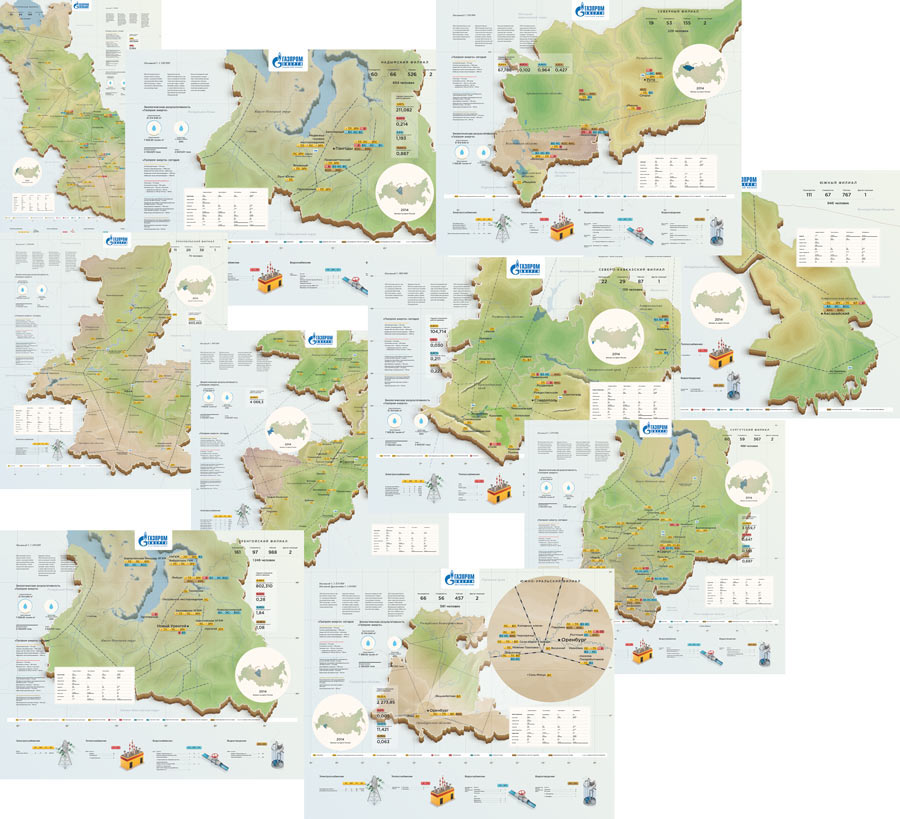
We like these new properties. Testing them on branch maps.
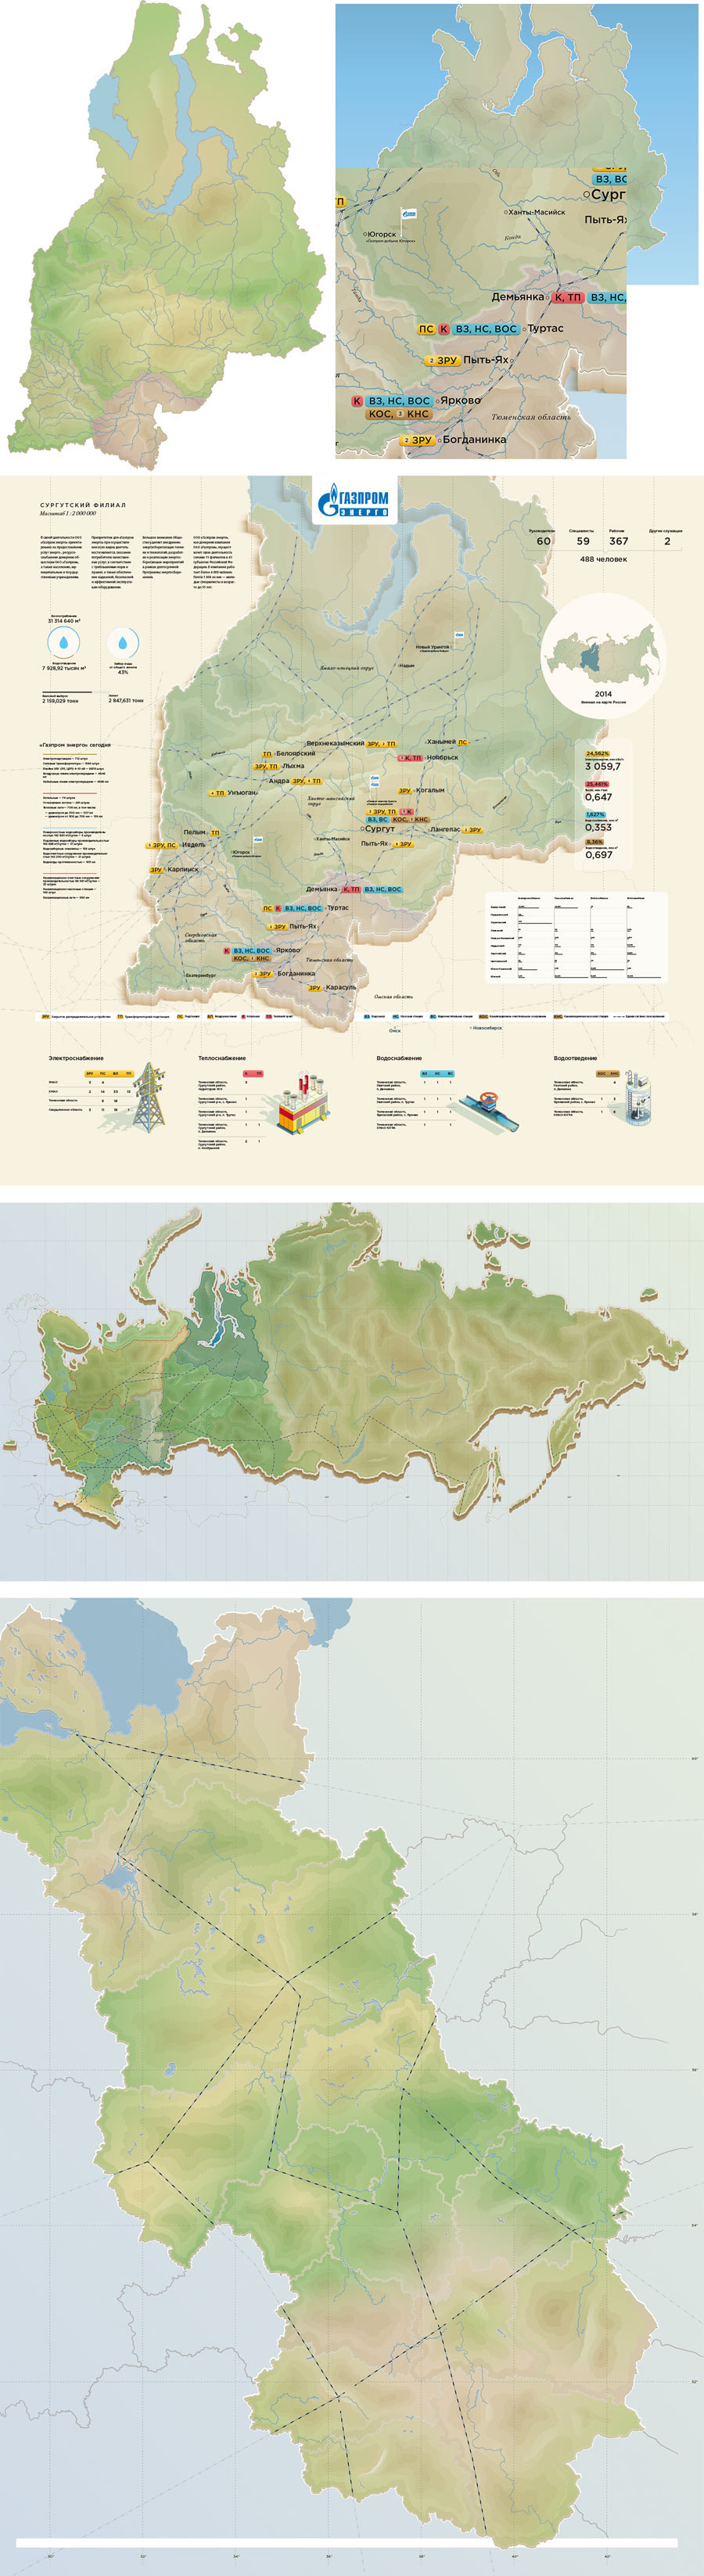
Convincing the client to get rid of sub-activity icons and replace them with abbreviations which make sense to professionals and can be read faster.
Improving activity icons based on the new look of the map.
Typesetting all the maps in a single style. Adjusting the static blocks, legend and performance blocks.
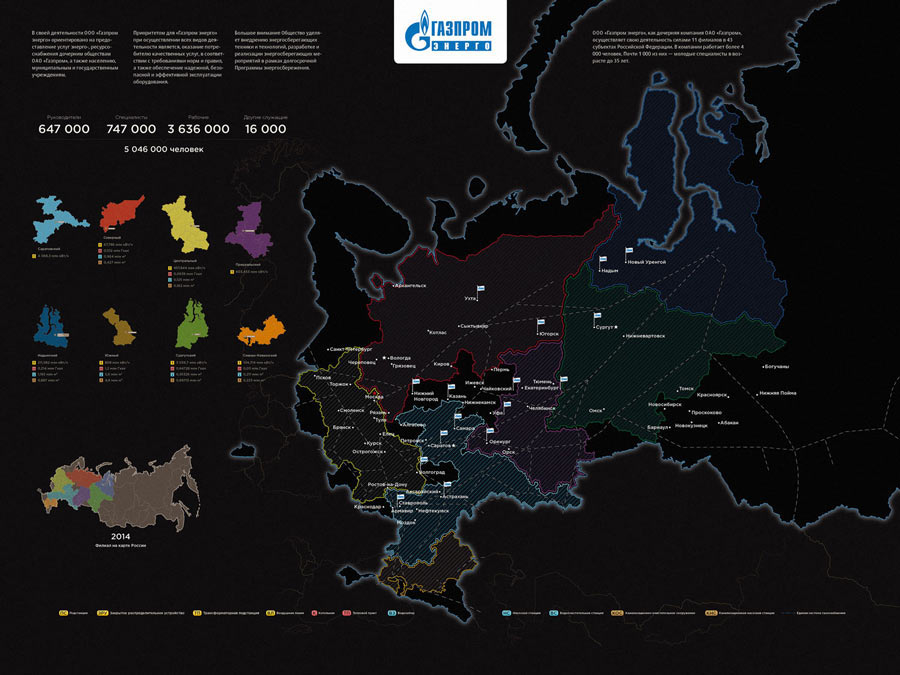
The art director says that the problem with the map of Russia remains, it’s still not clear why there is no coverage in the Eastern part. In computer games unexplored areas are usually shown as slightly snowy or whitened-out. Which is just what we need.
Making many more corrections based on the client feedback, checking the correctness of the degree grid, mountainous terrain, topology, main rivers and sending for color proofing.
