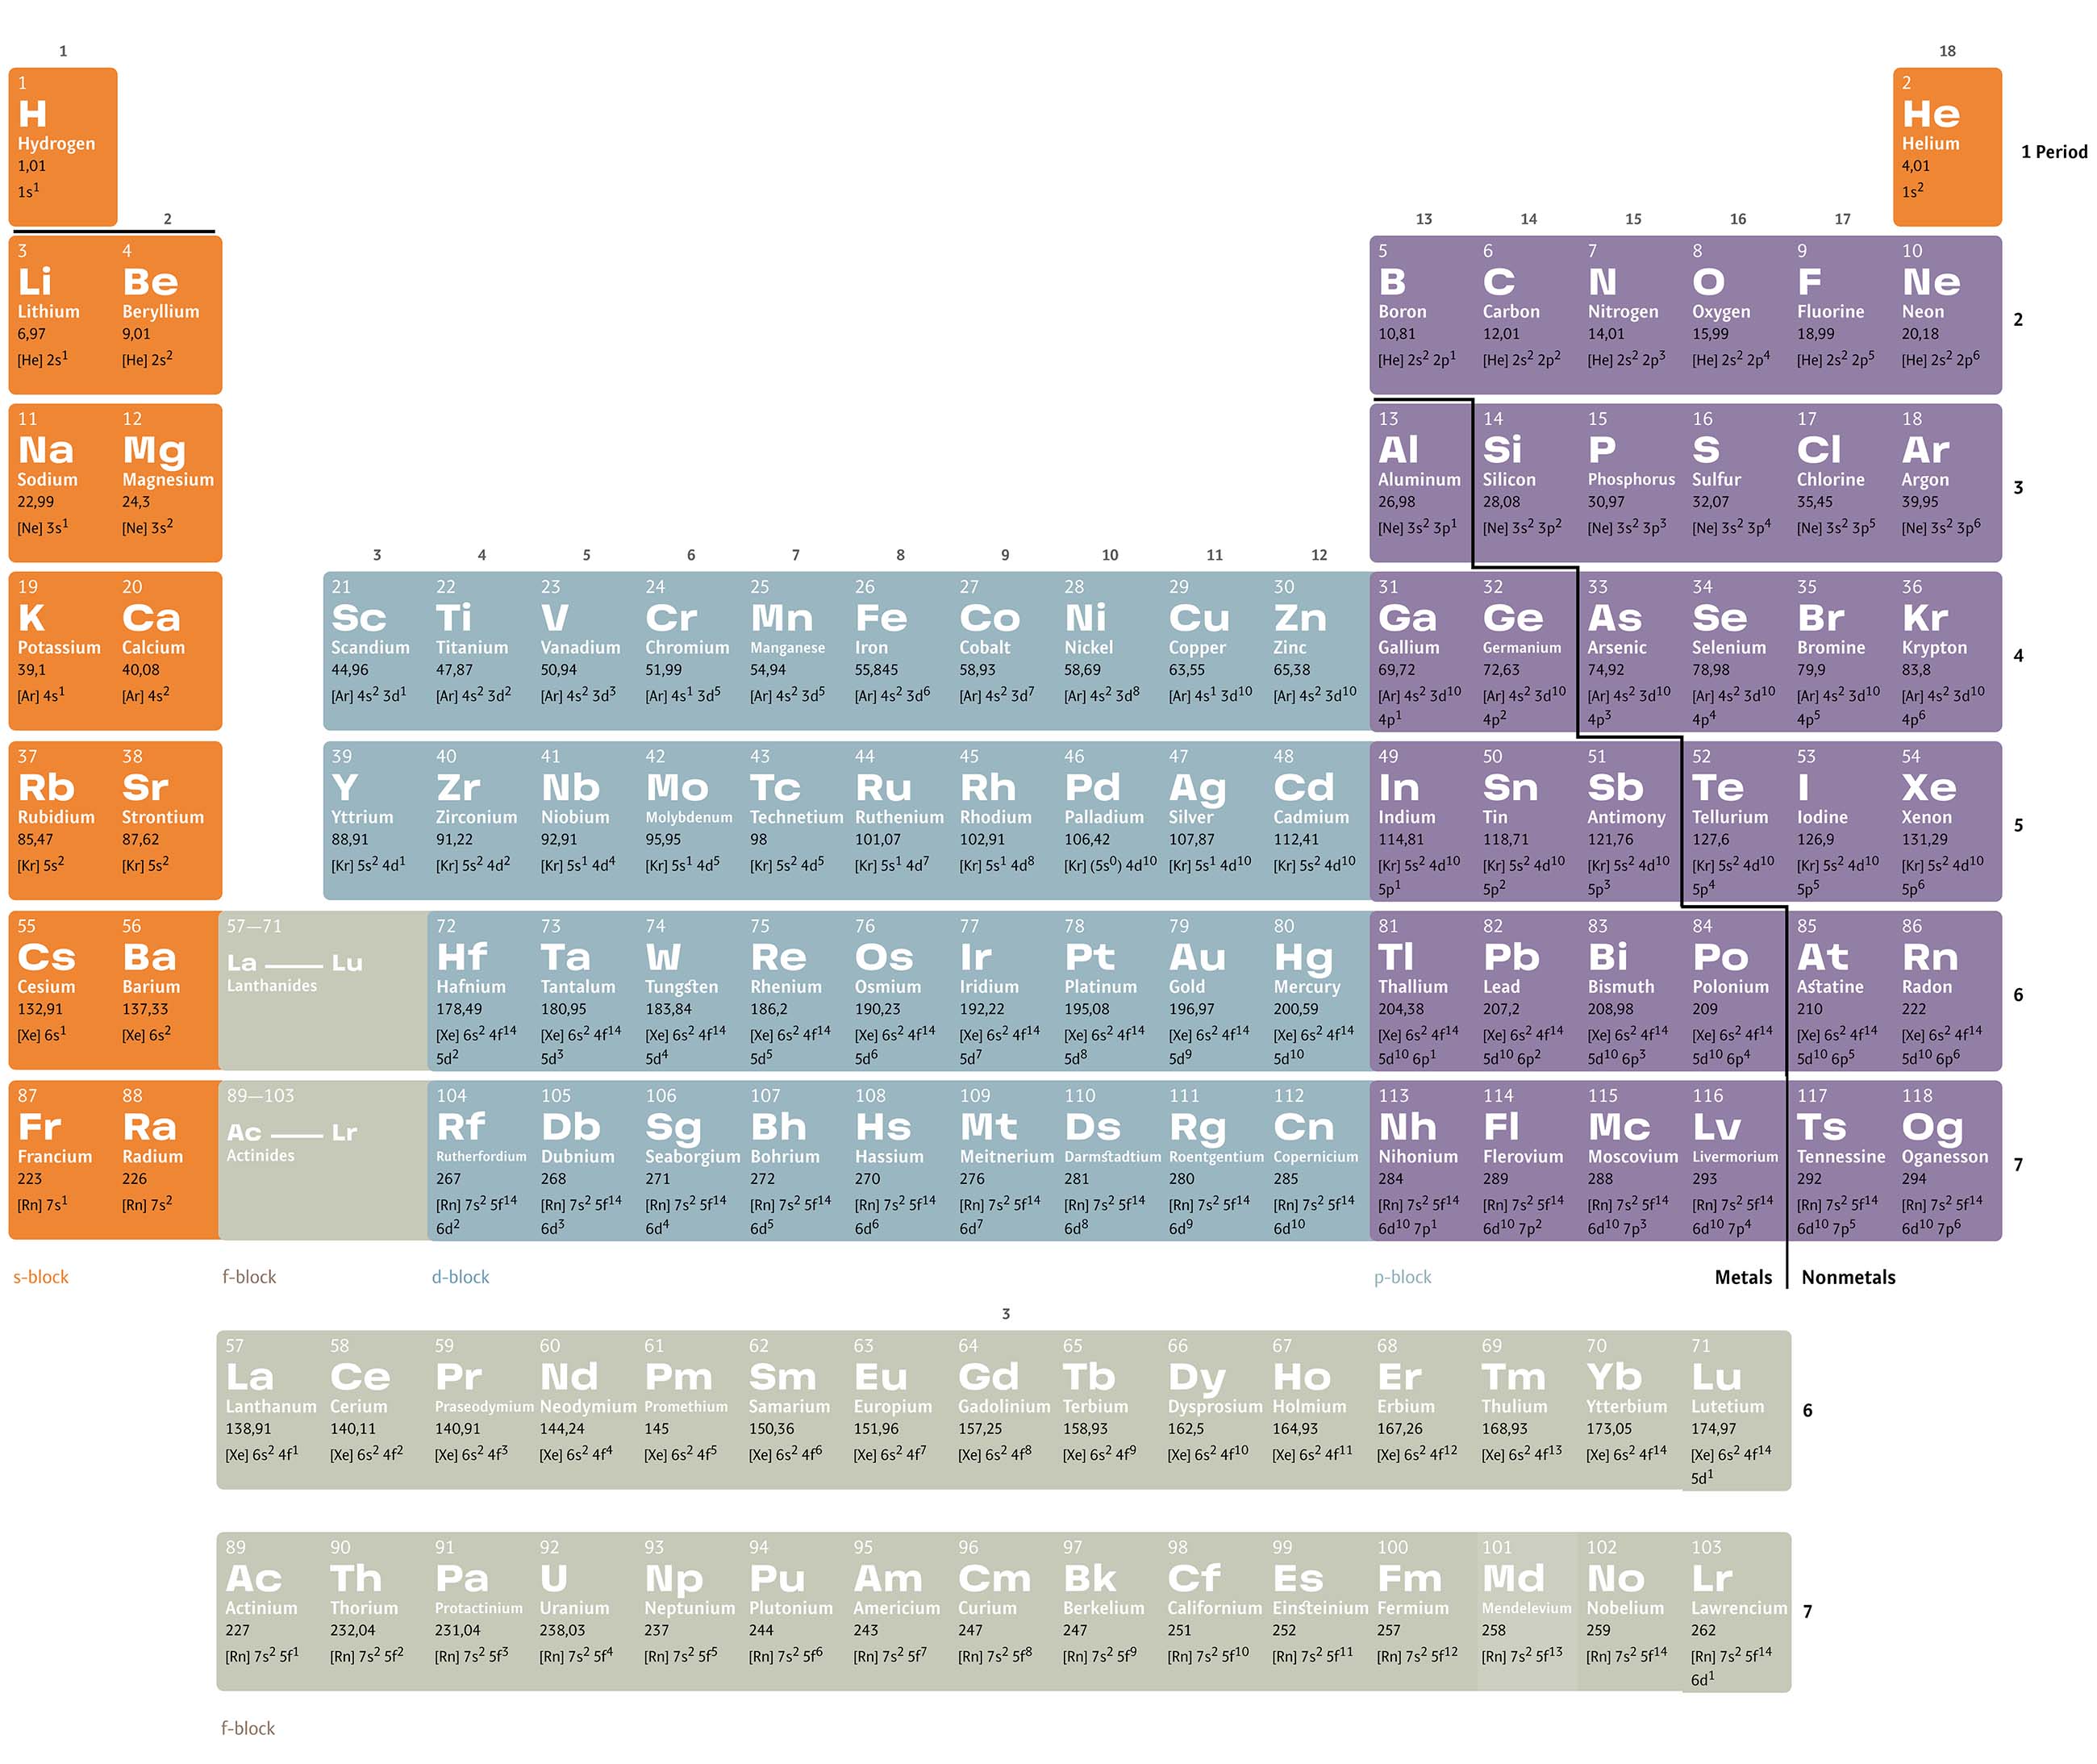
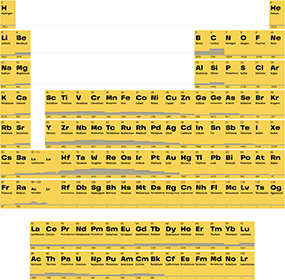
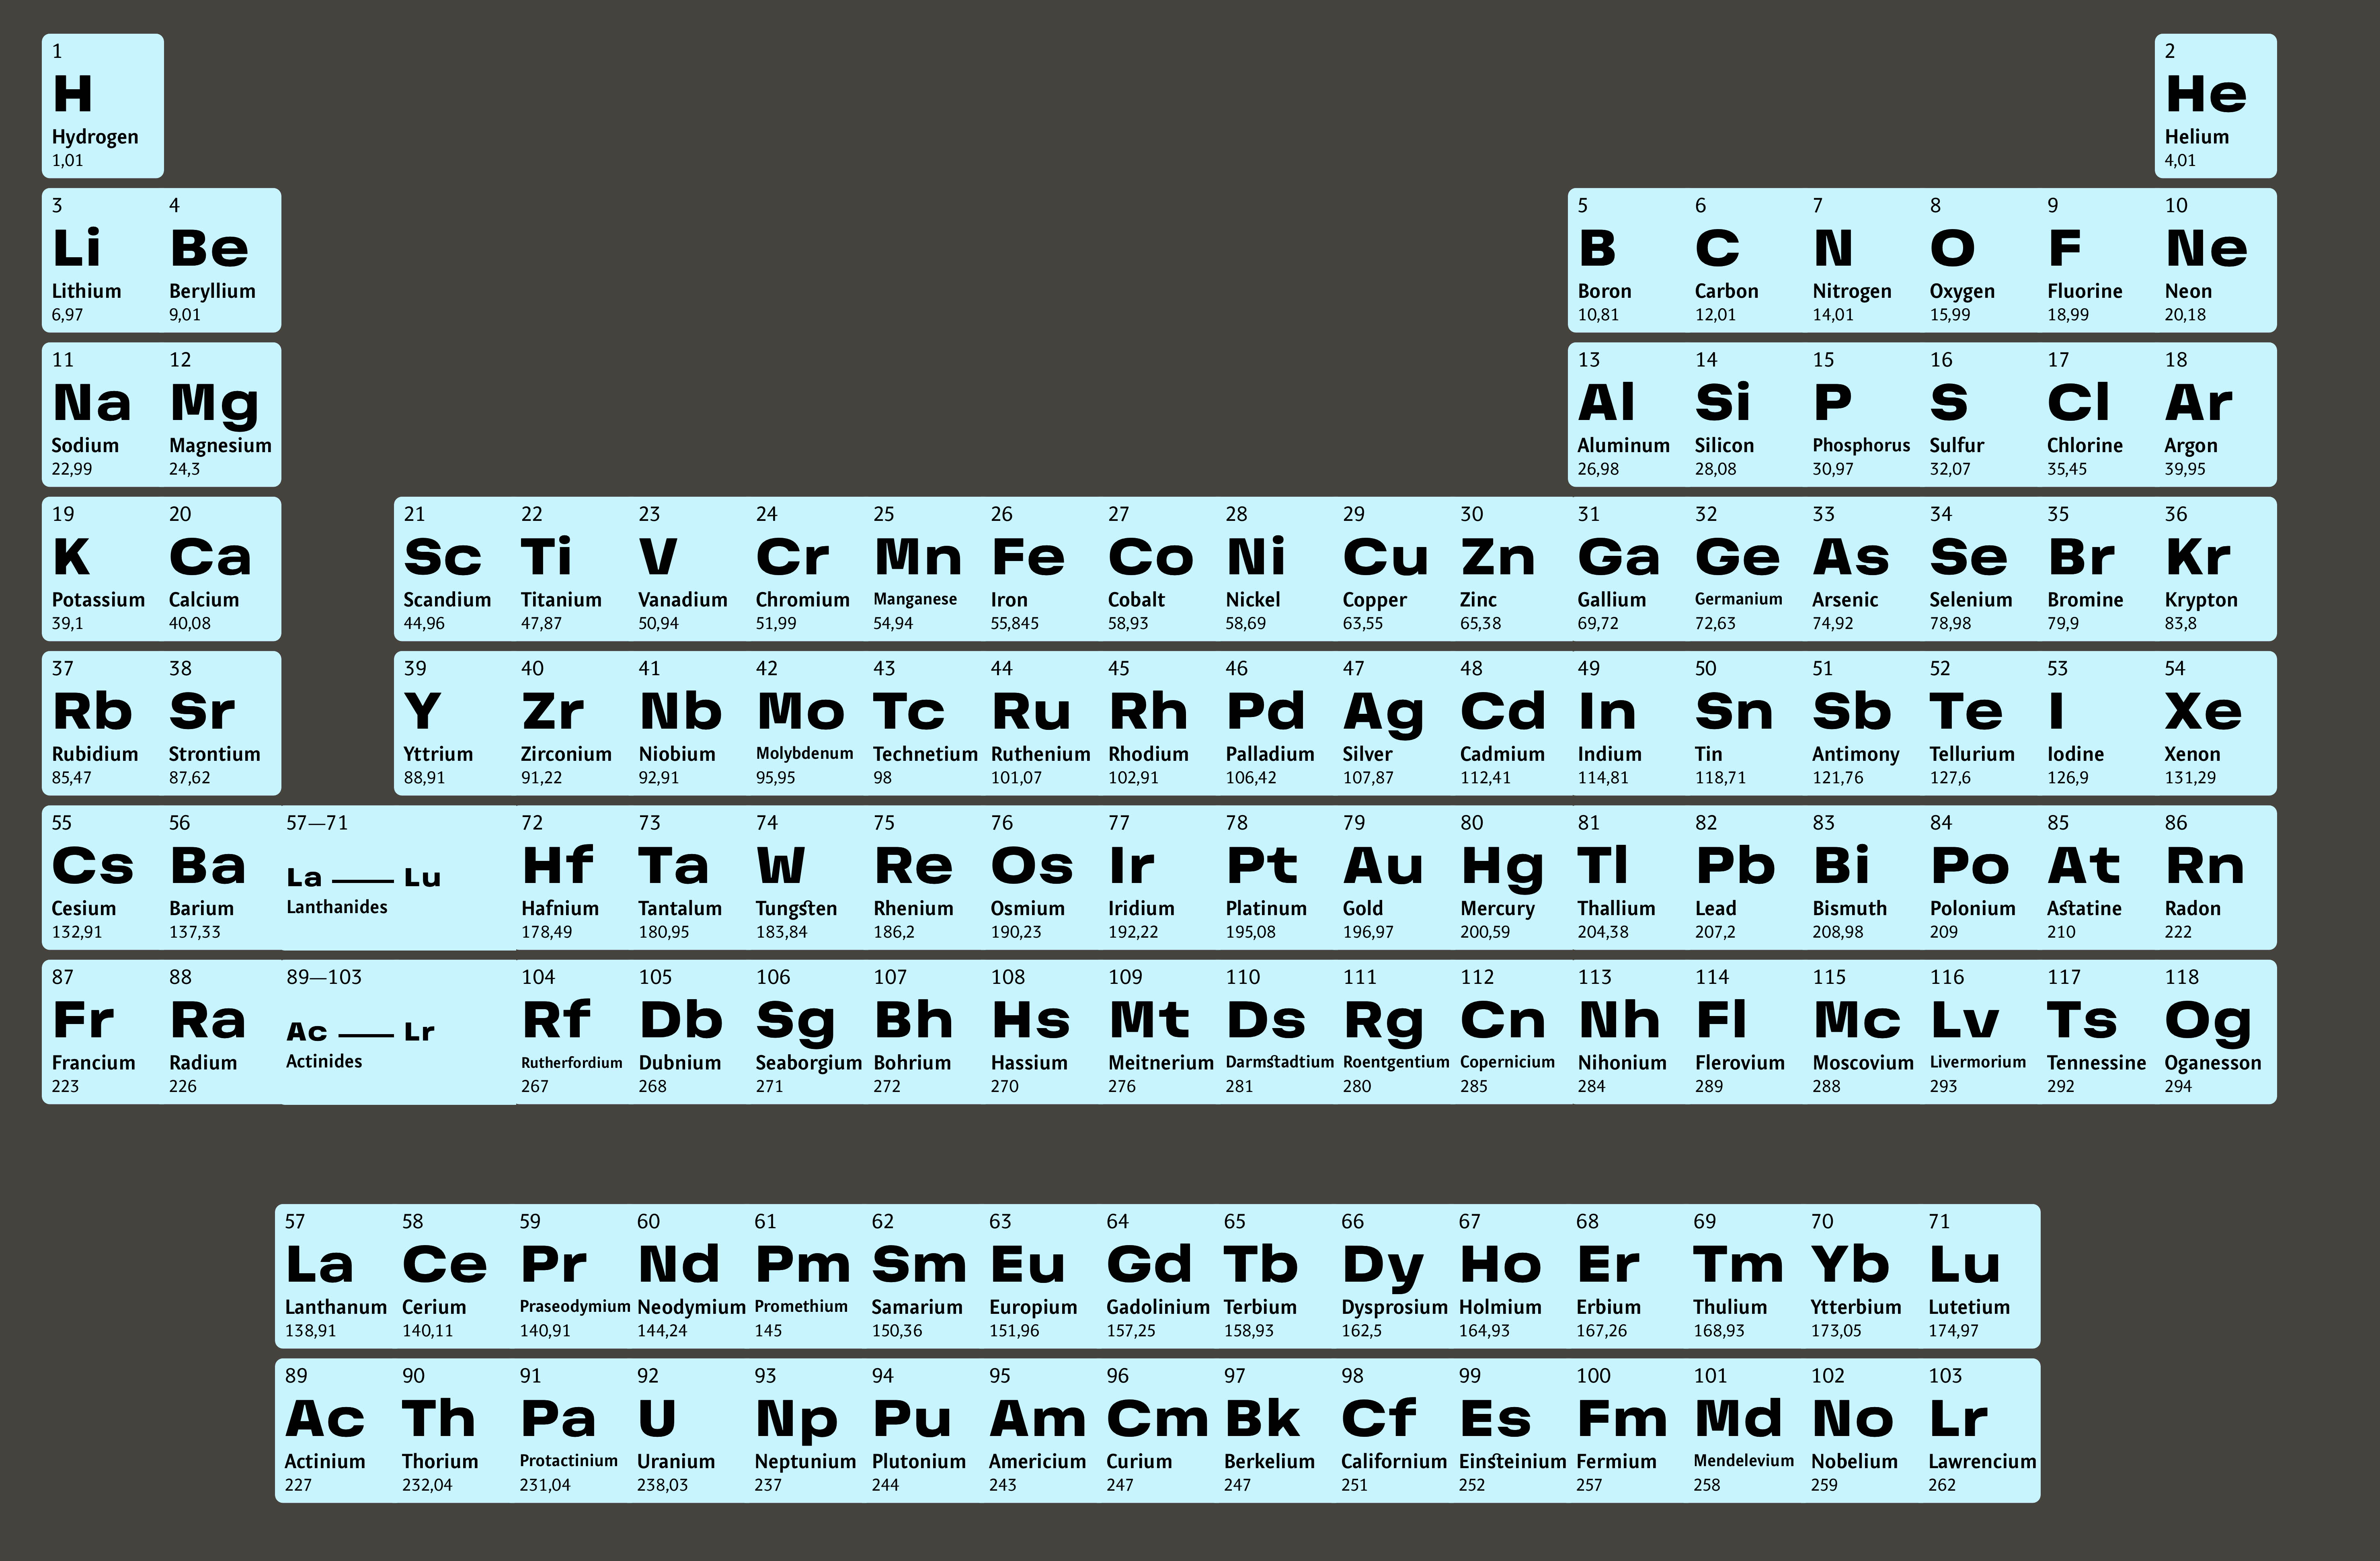
Periodic table of elements
The Periodic table is a graphic representation of the fundamental laws of nature and a day-to-day tool for thousands of people across the globe.


Given the number of properties for each element and its many applications, how the table should look has long been a subject of debate.
Showing the kind of information used by a chemist would scare your average student, but a stripped back version may be useless to a professional. So, most designs end up as a compromise.
We’ve come up with a table that works for everybody.
No more arguments over how the ‘ideal’ table should look. Customization wins.
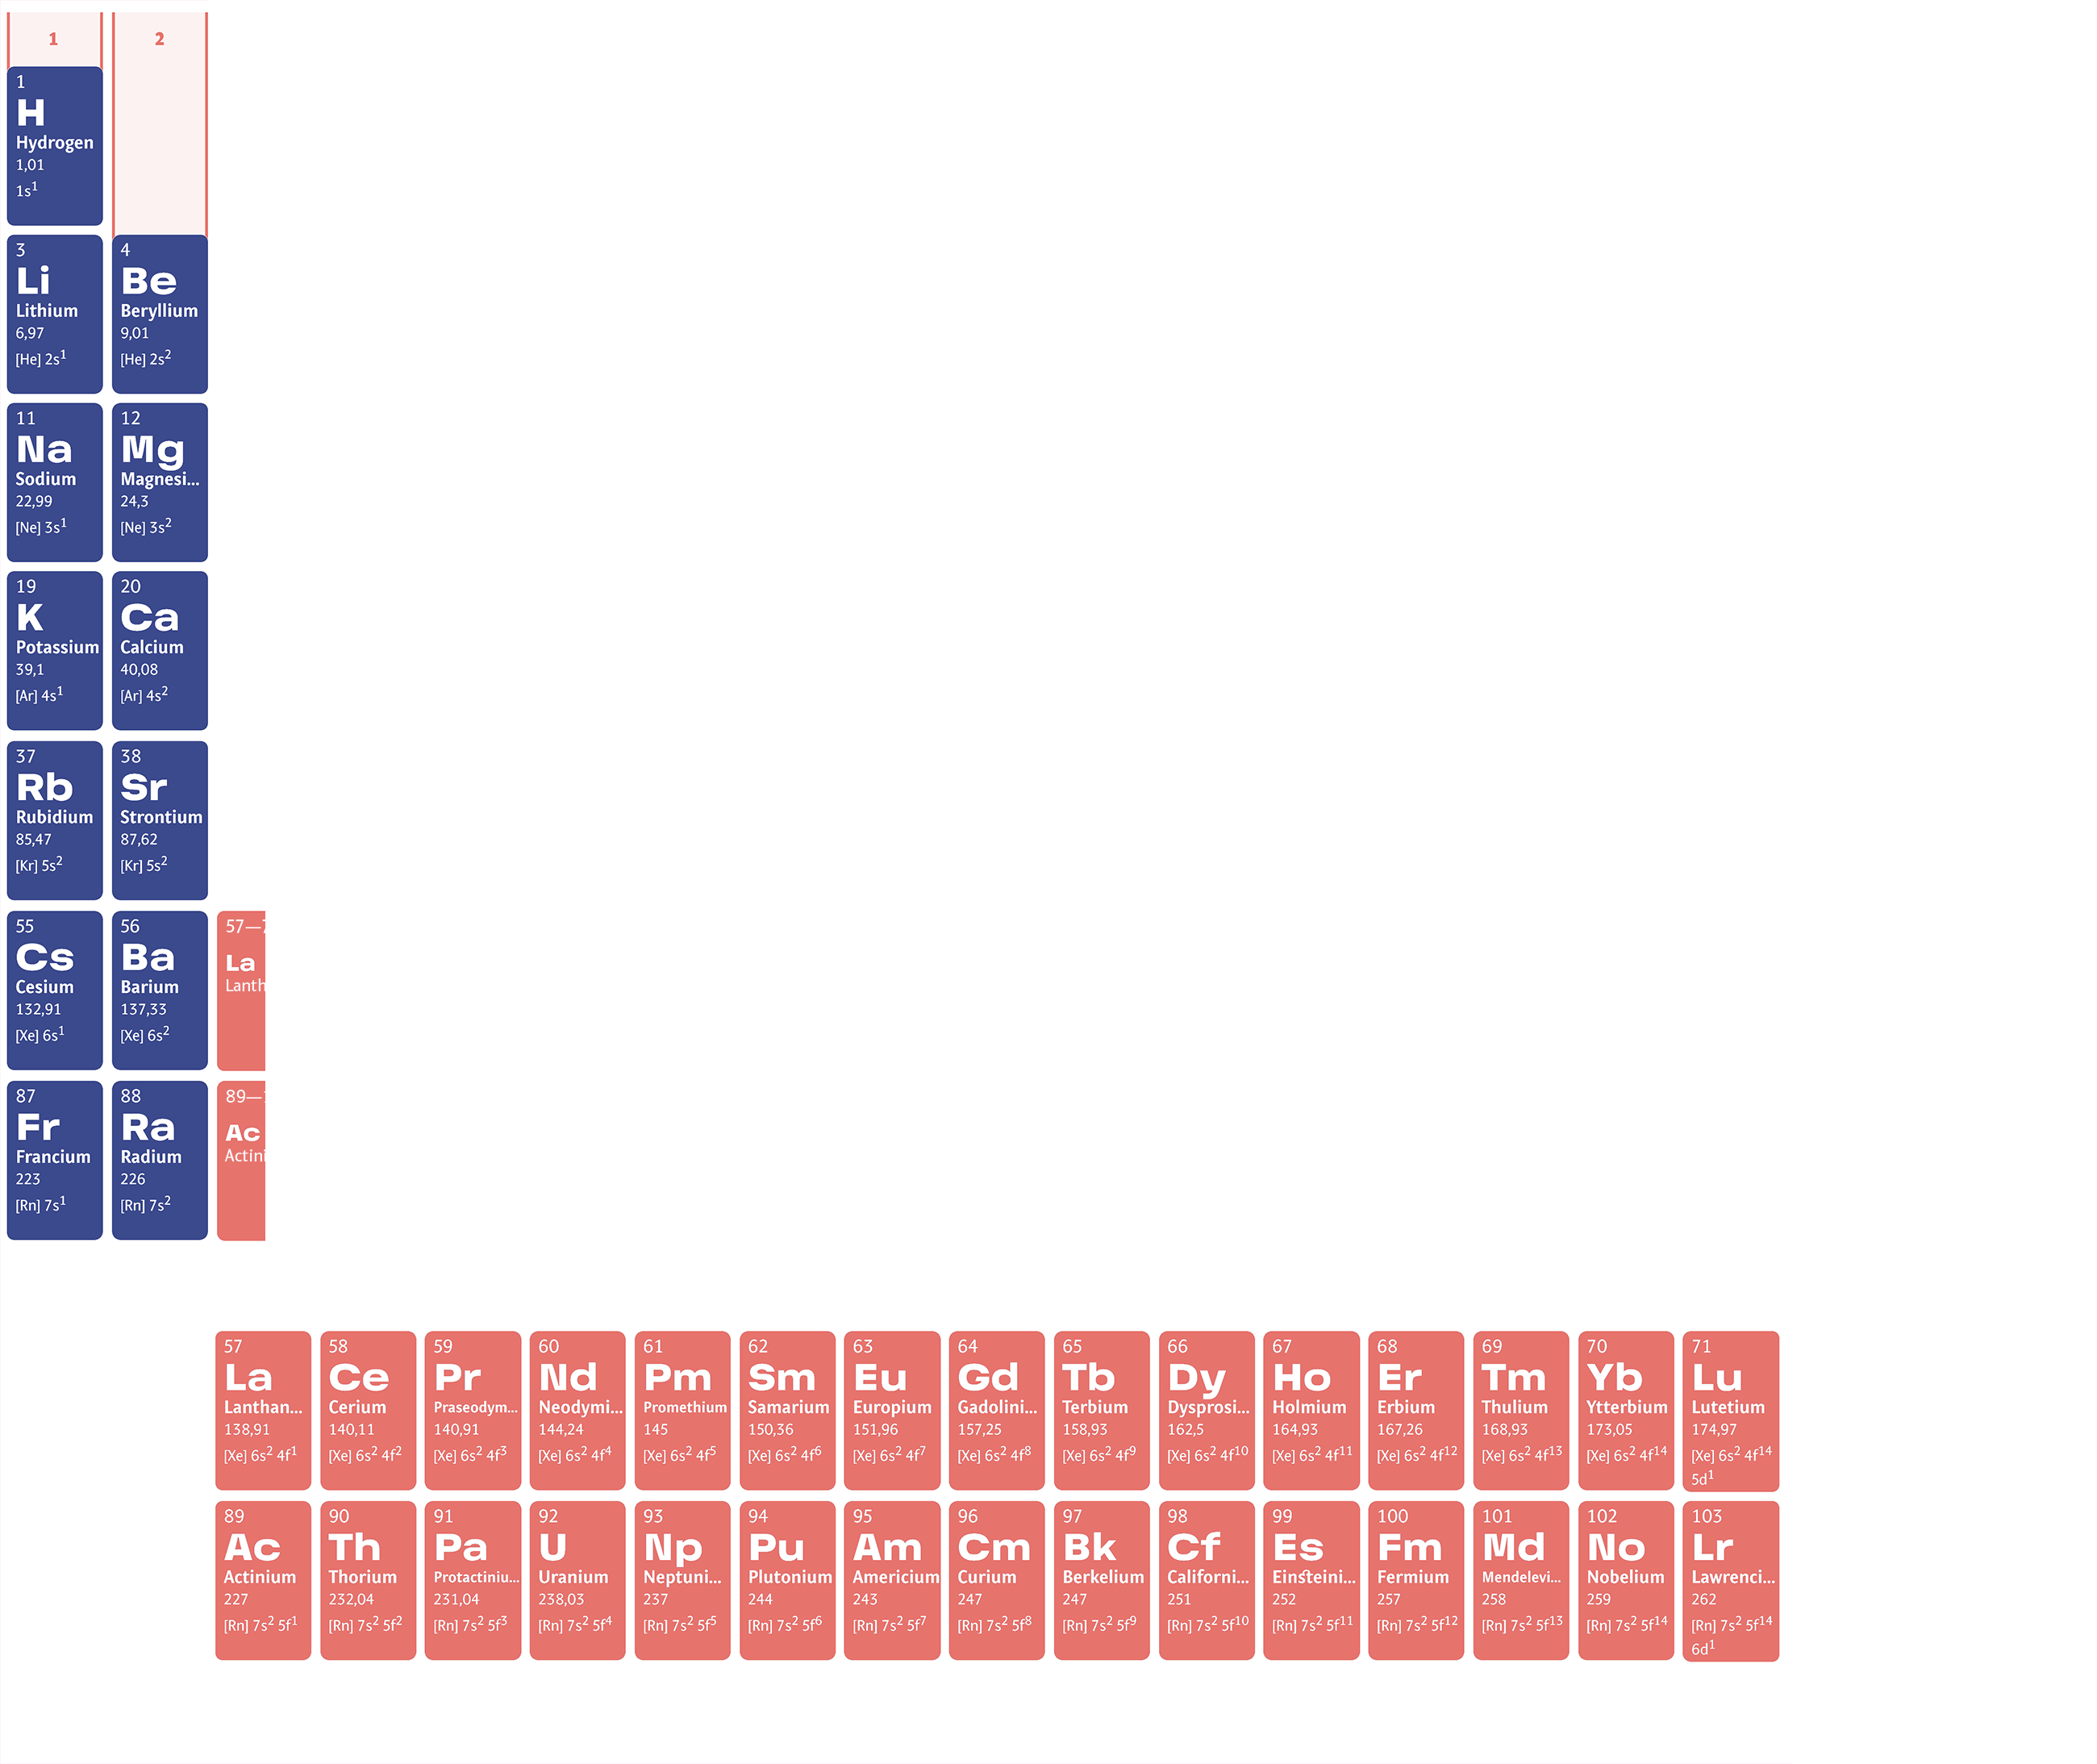
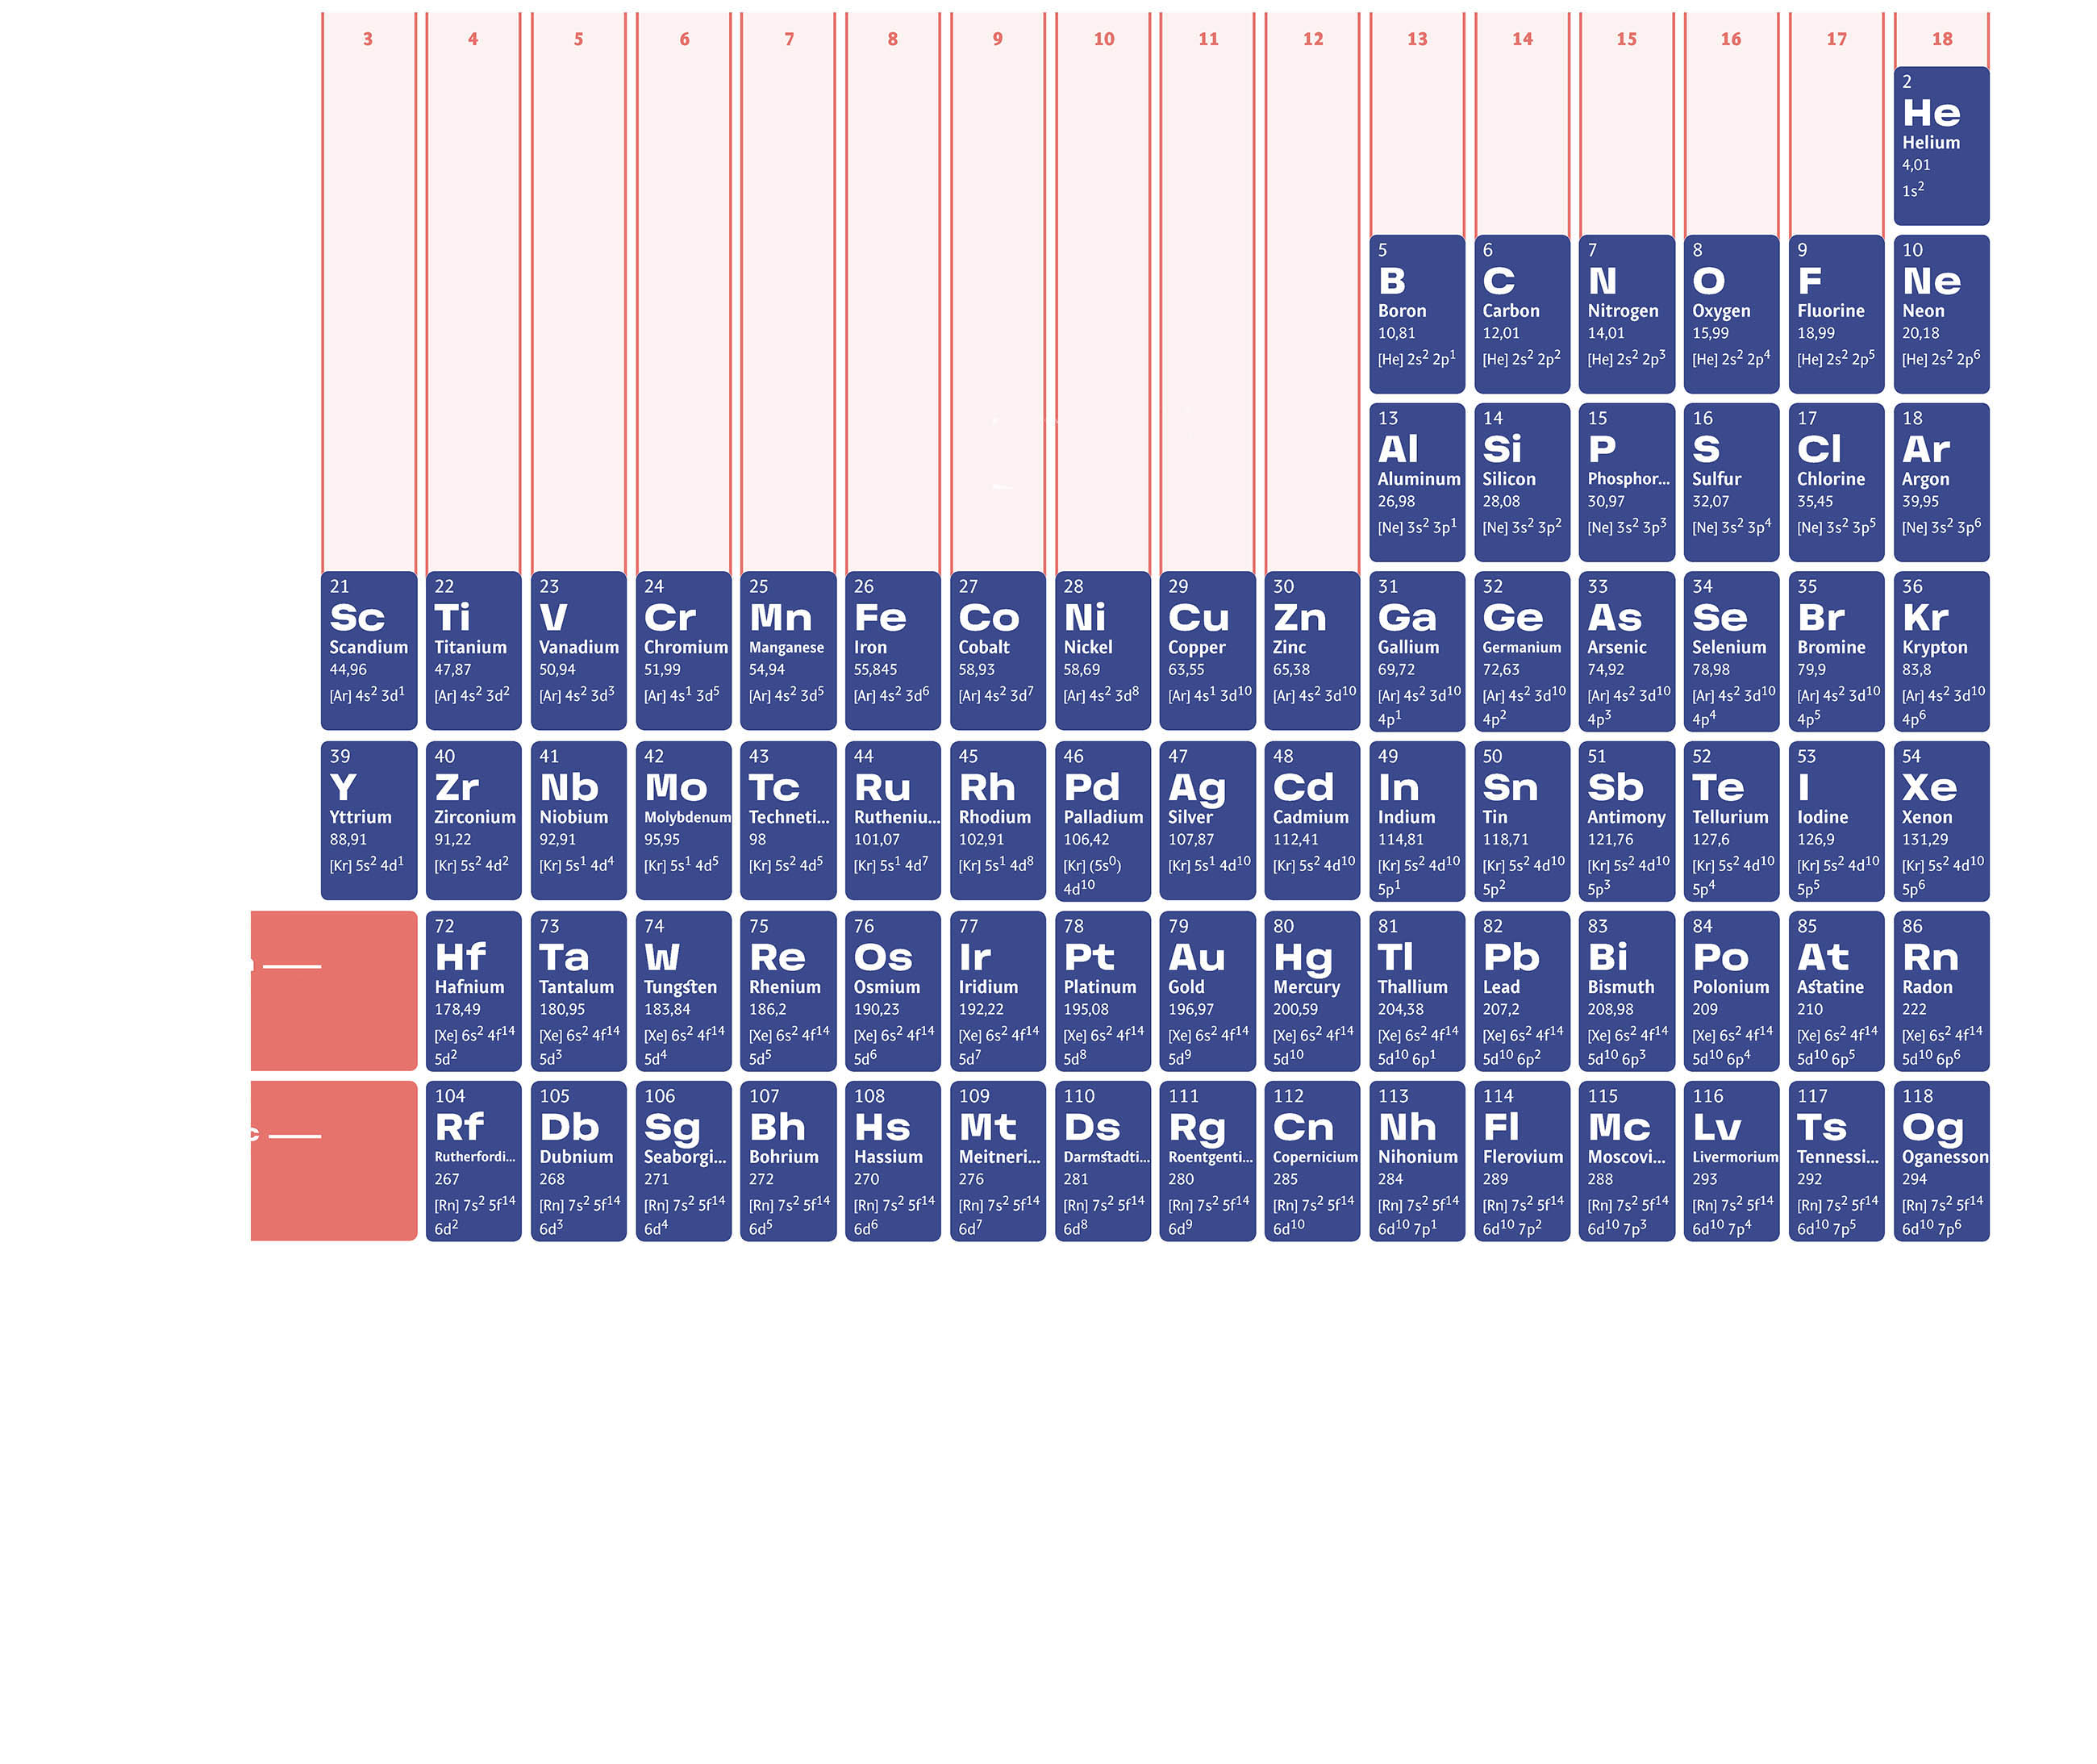
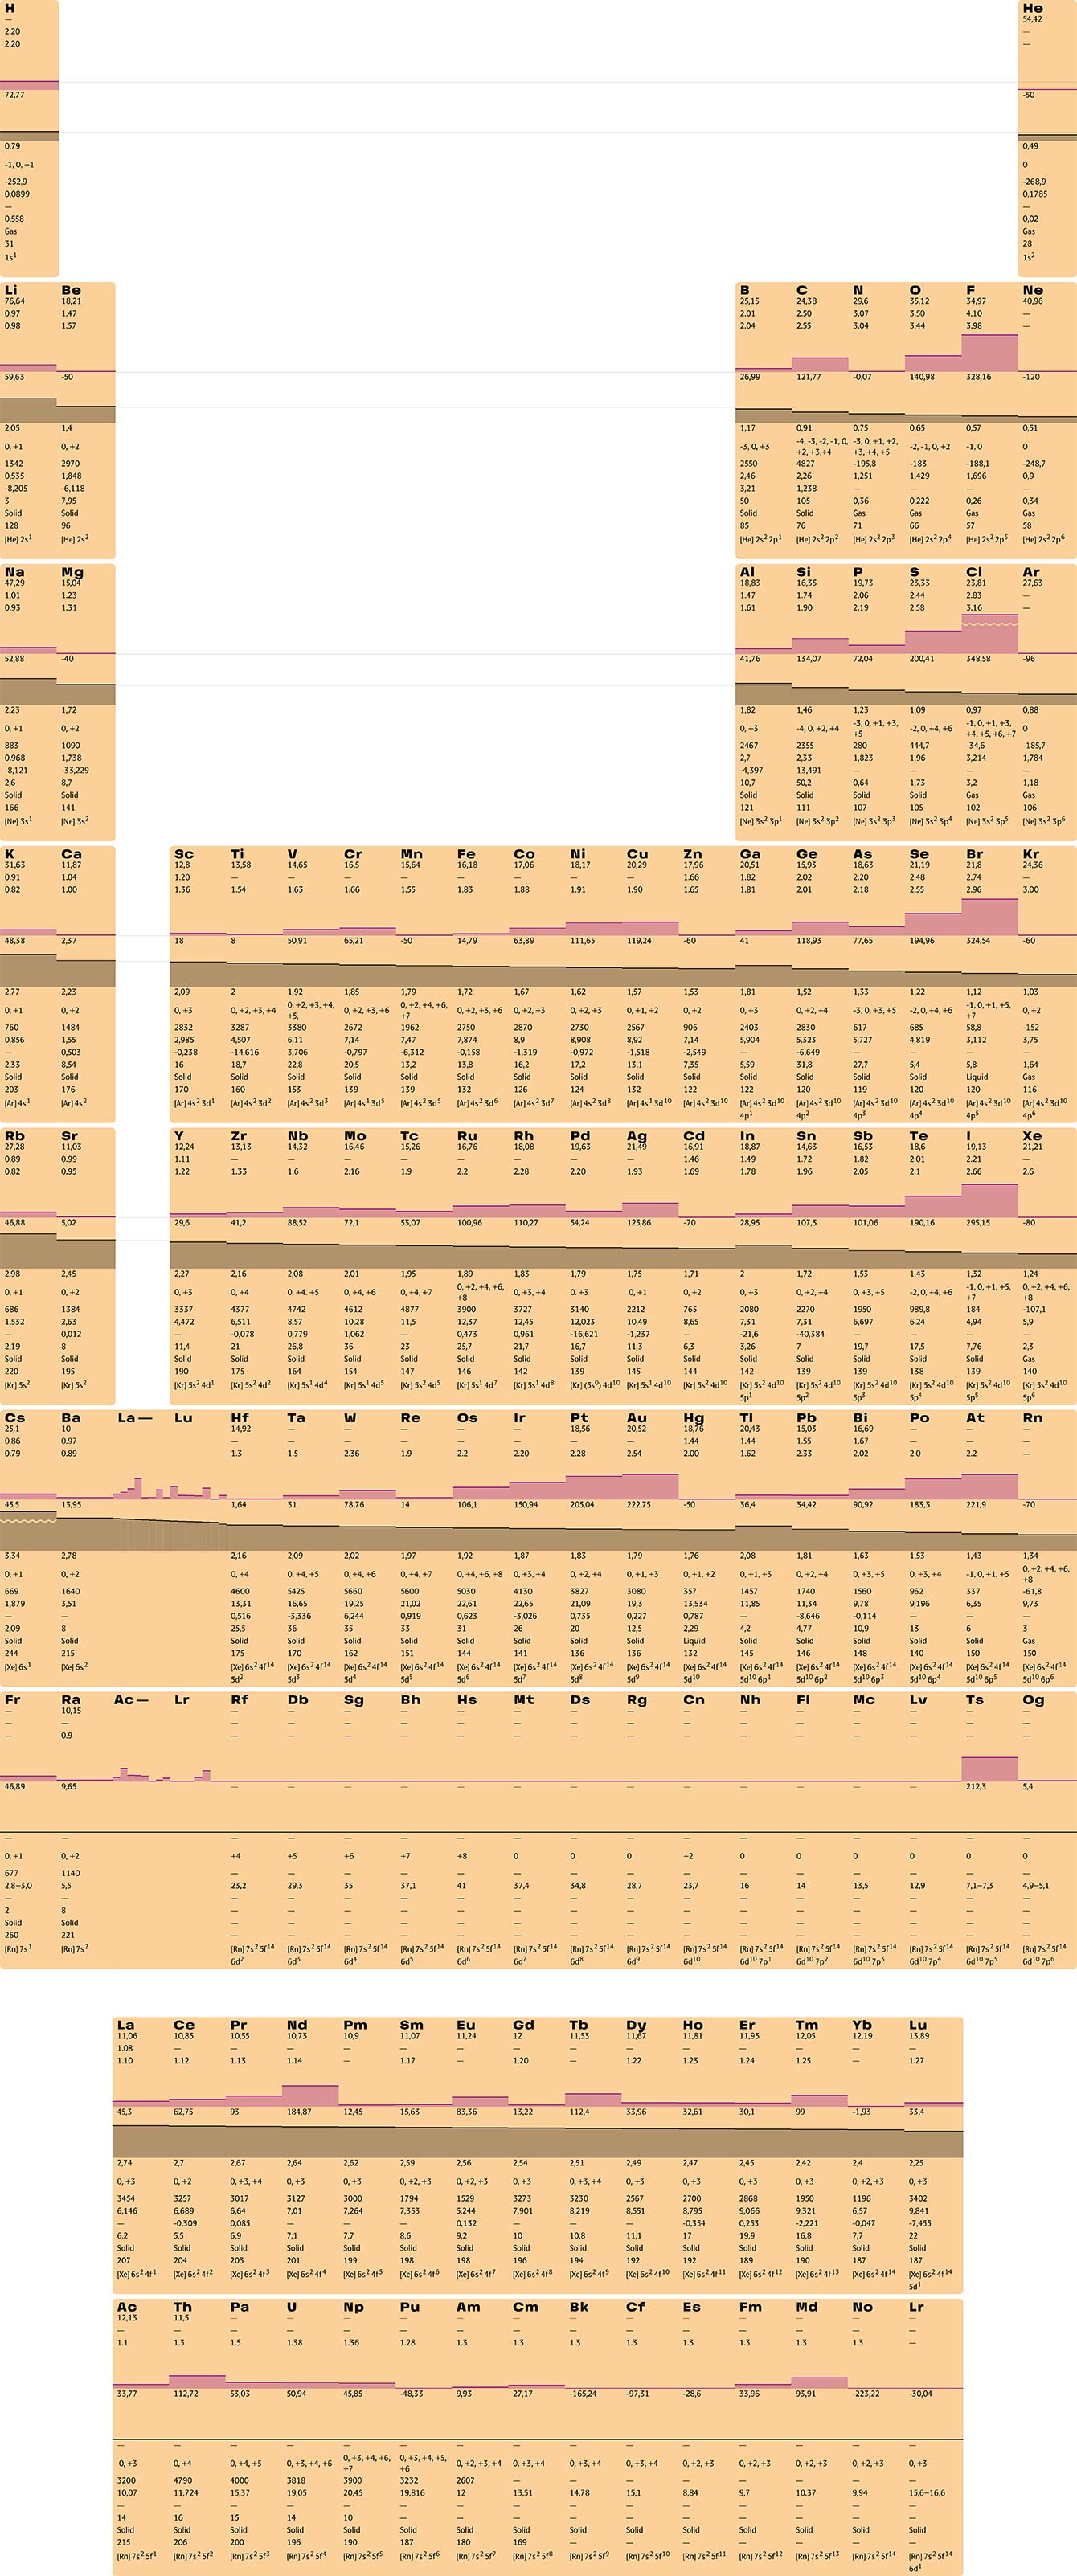
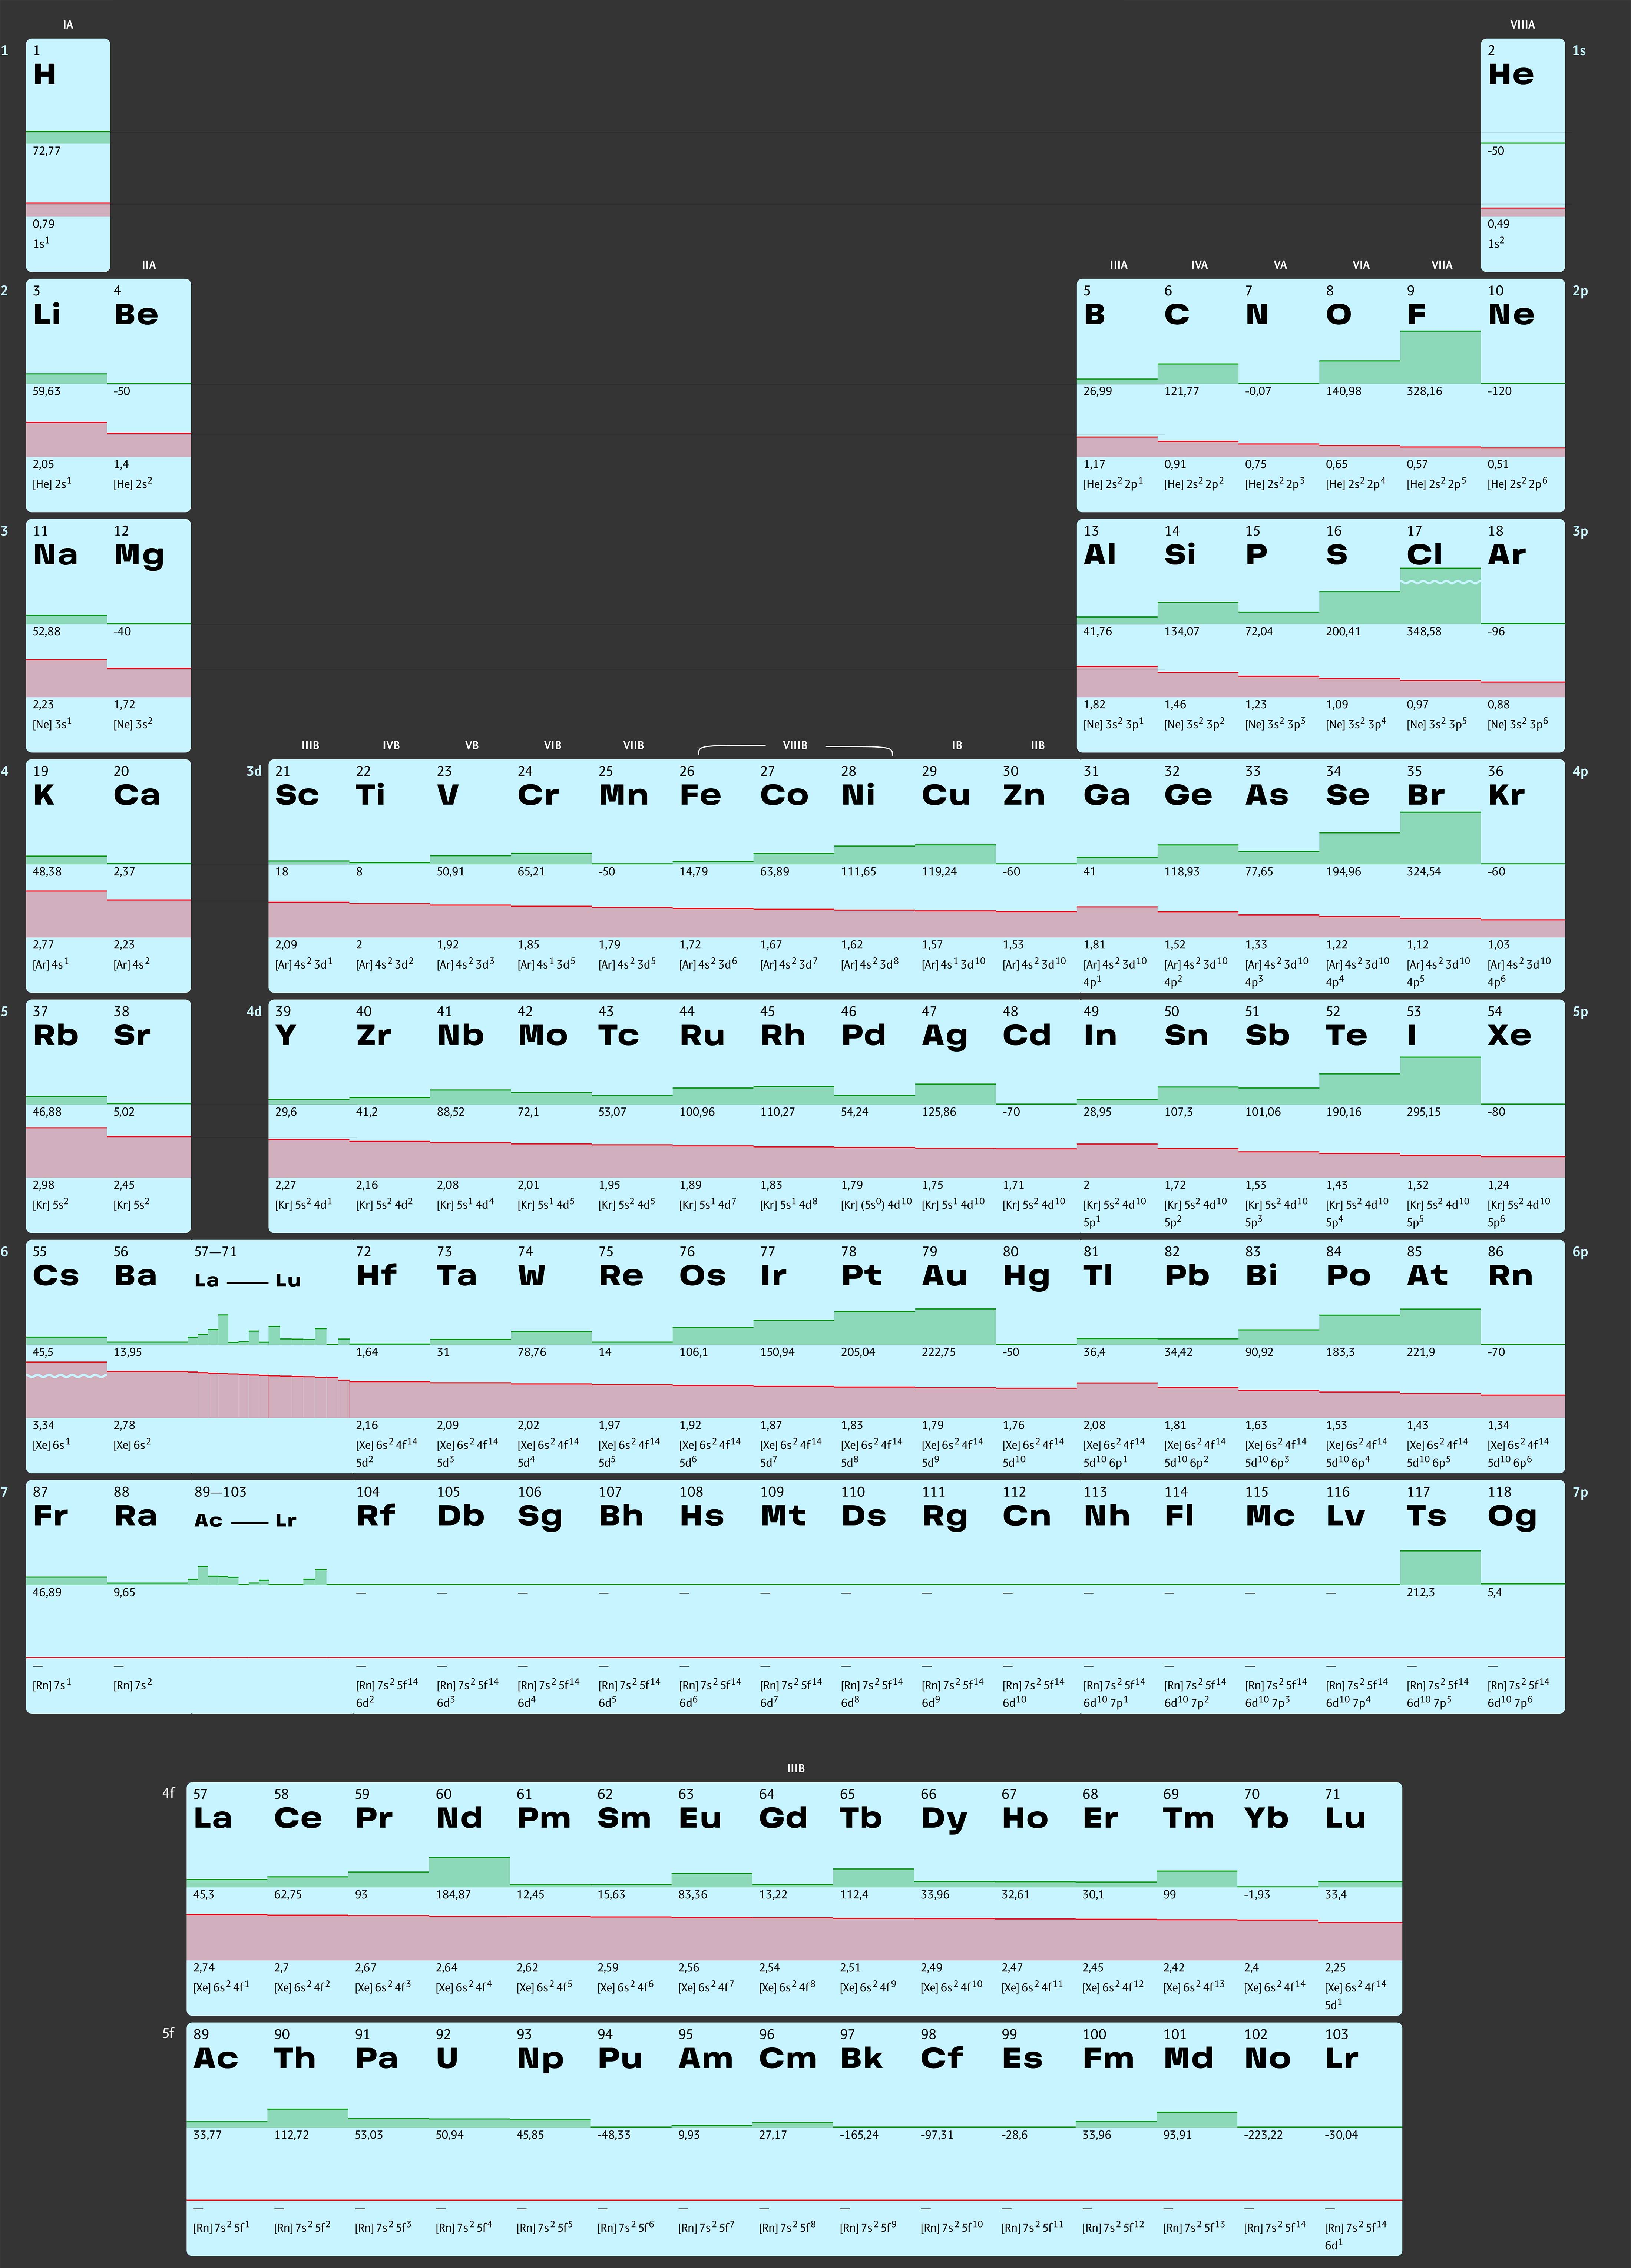
We developed a table with an adjustable layout that displays only the required data.
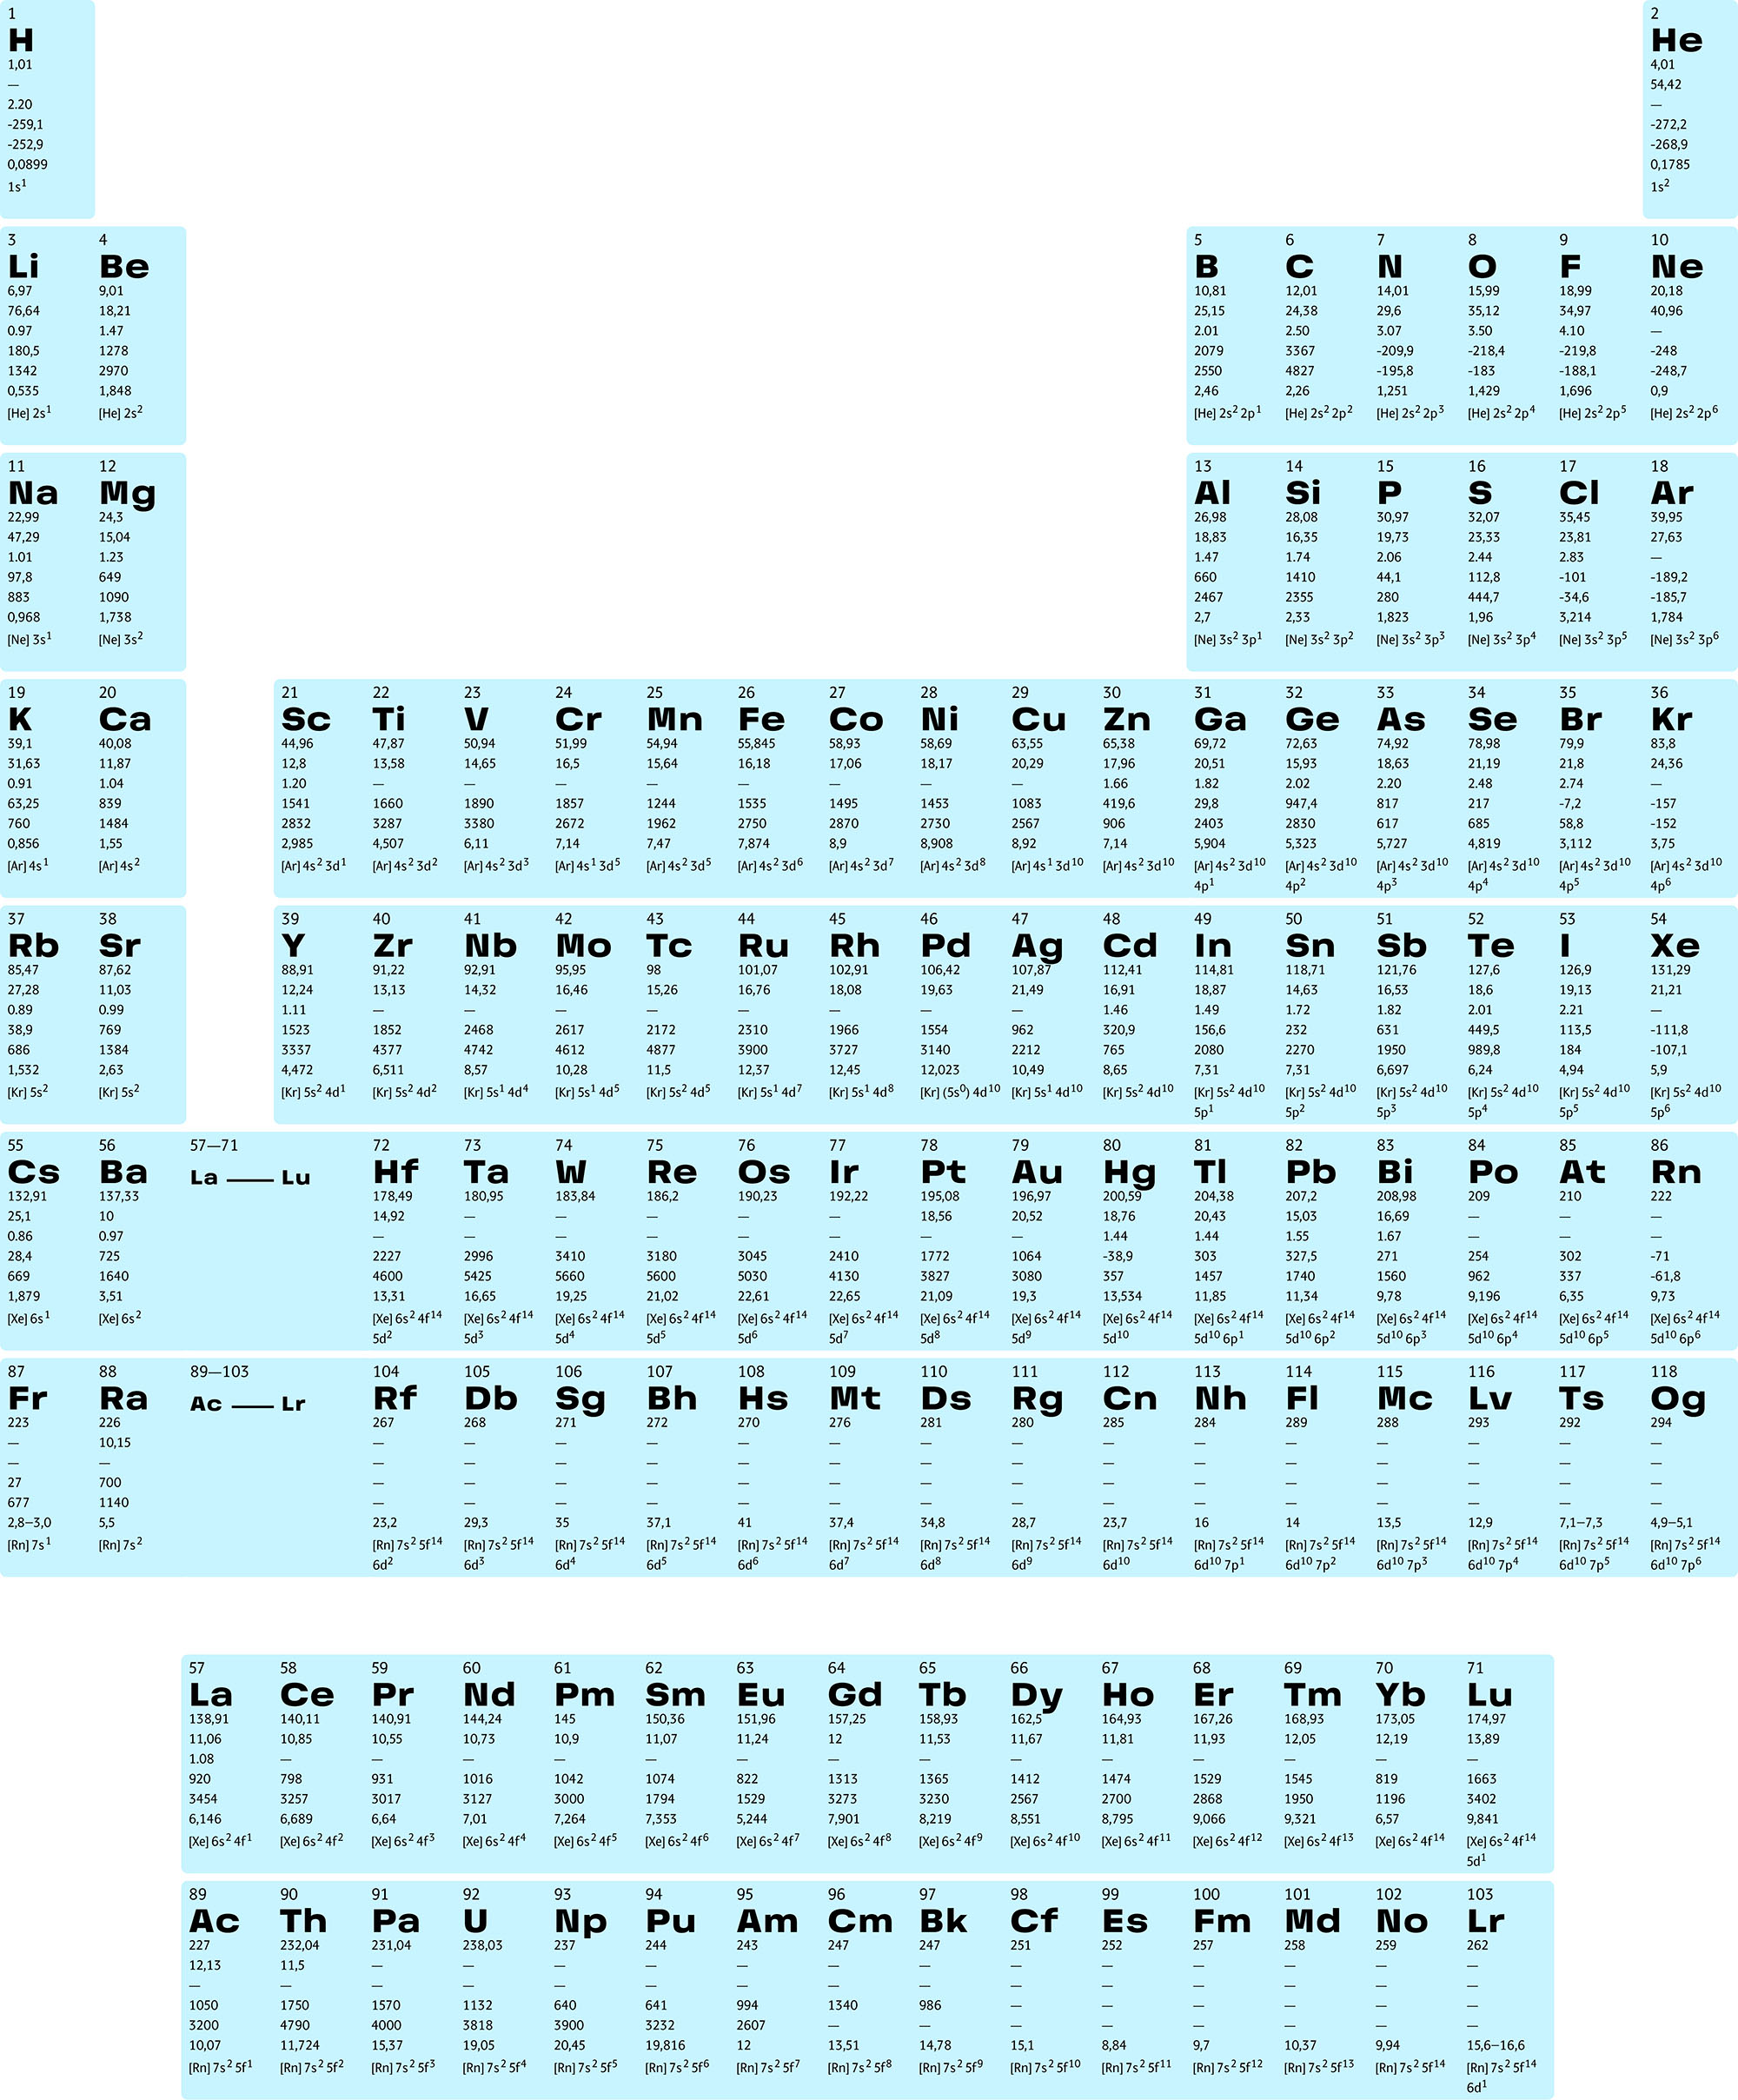
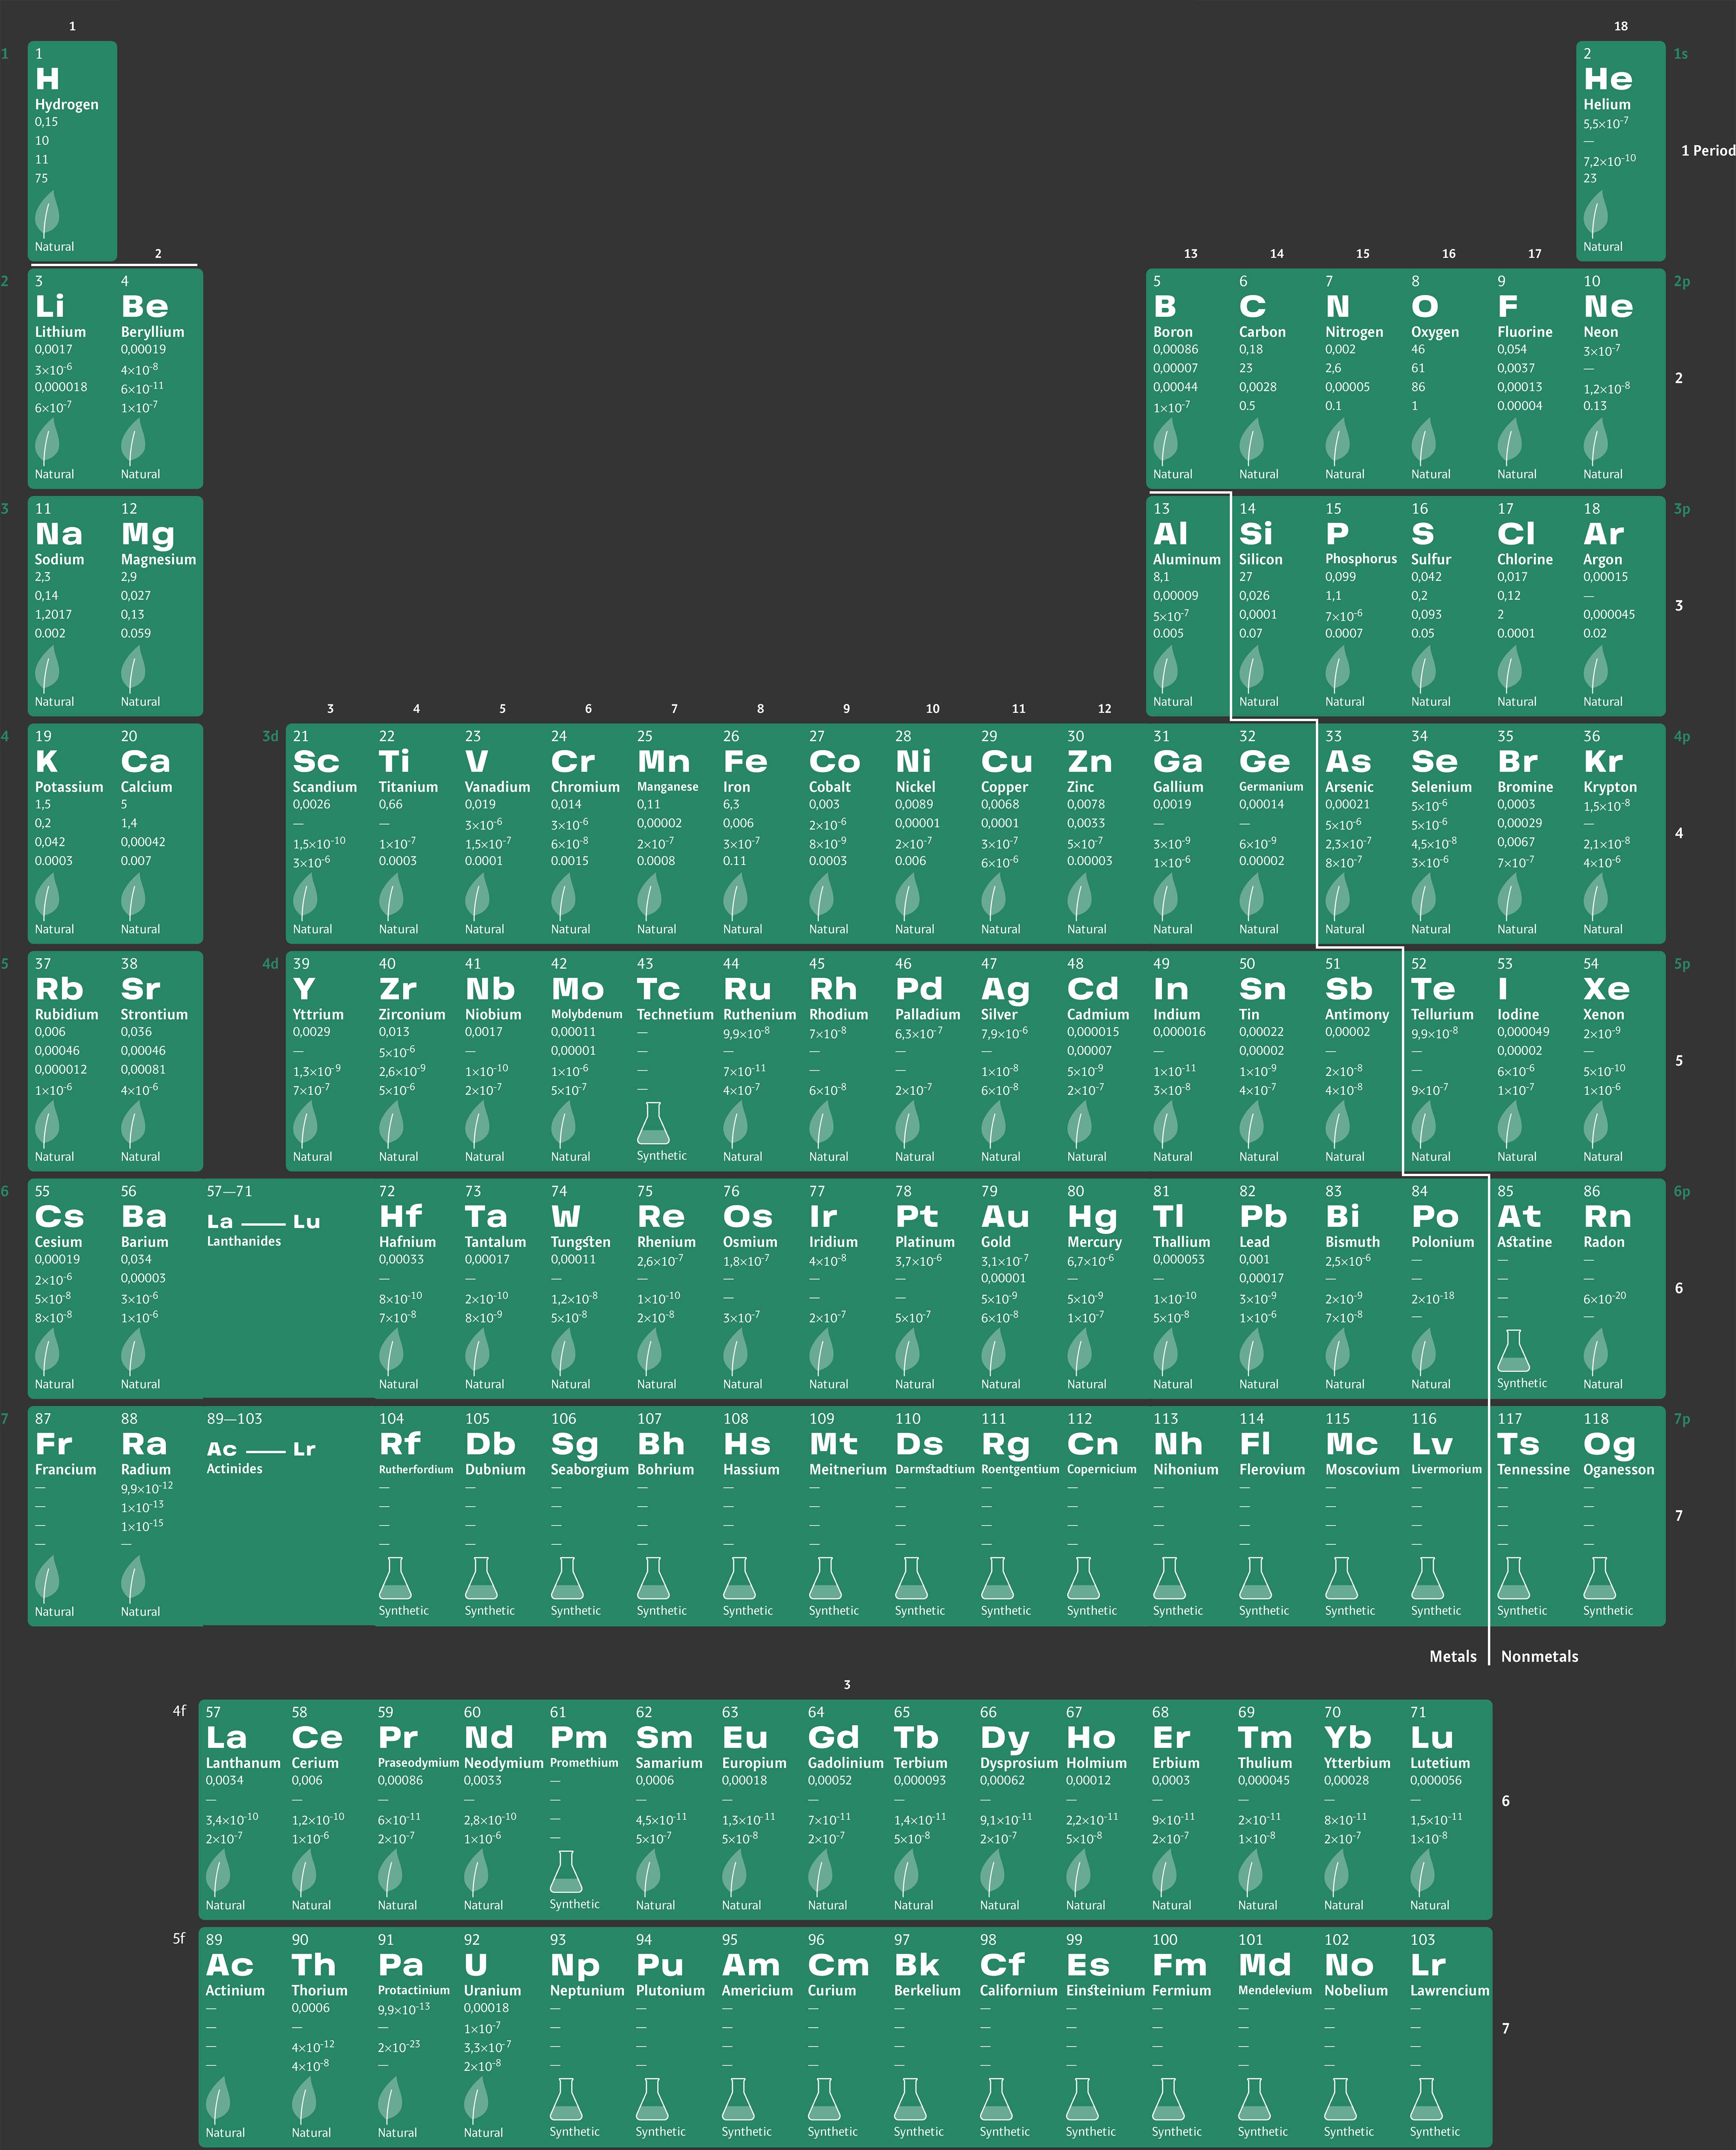
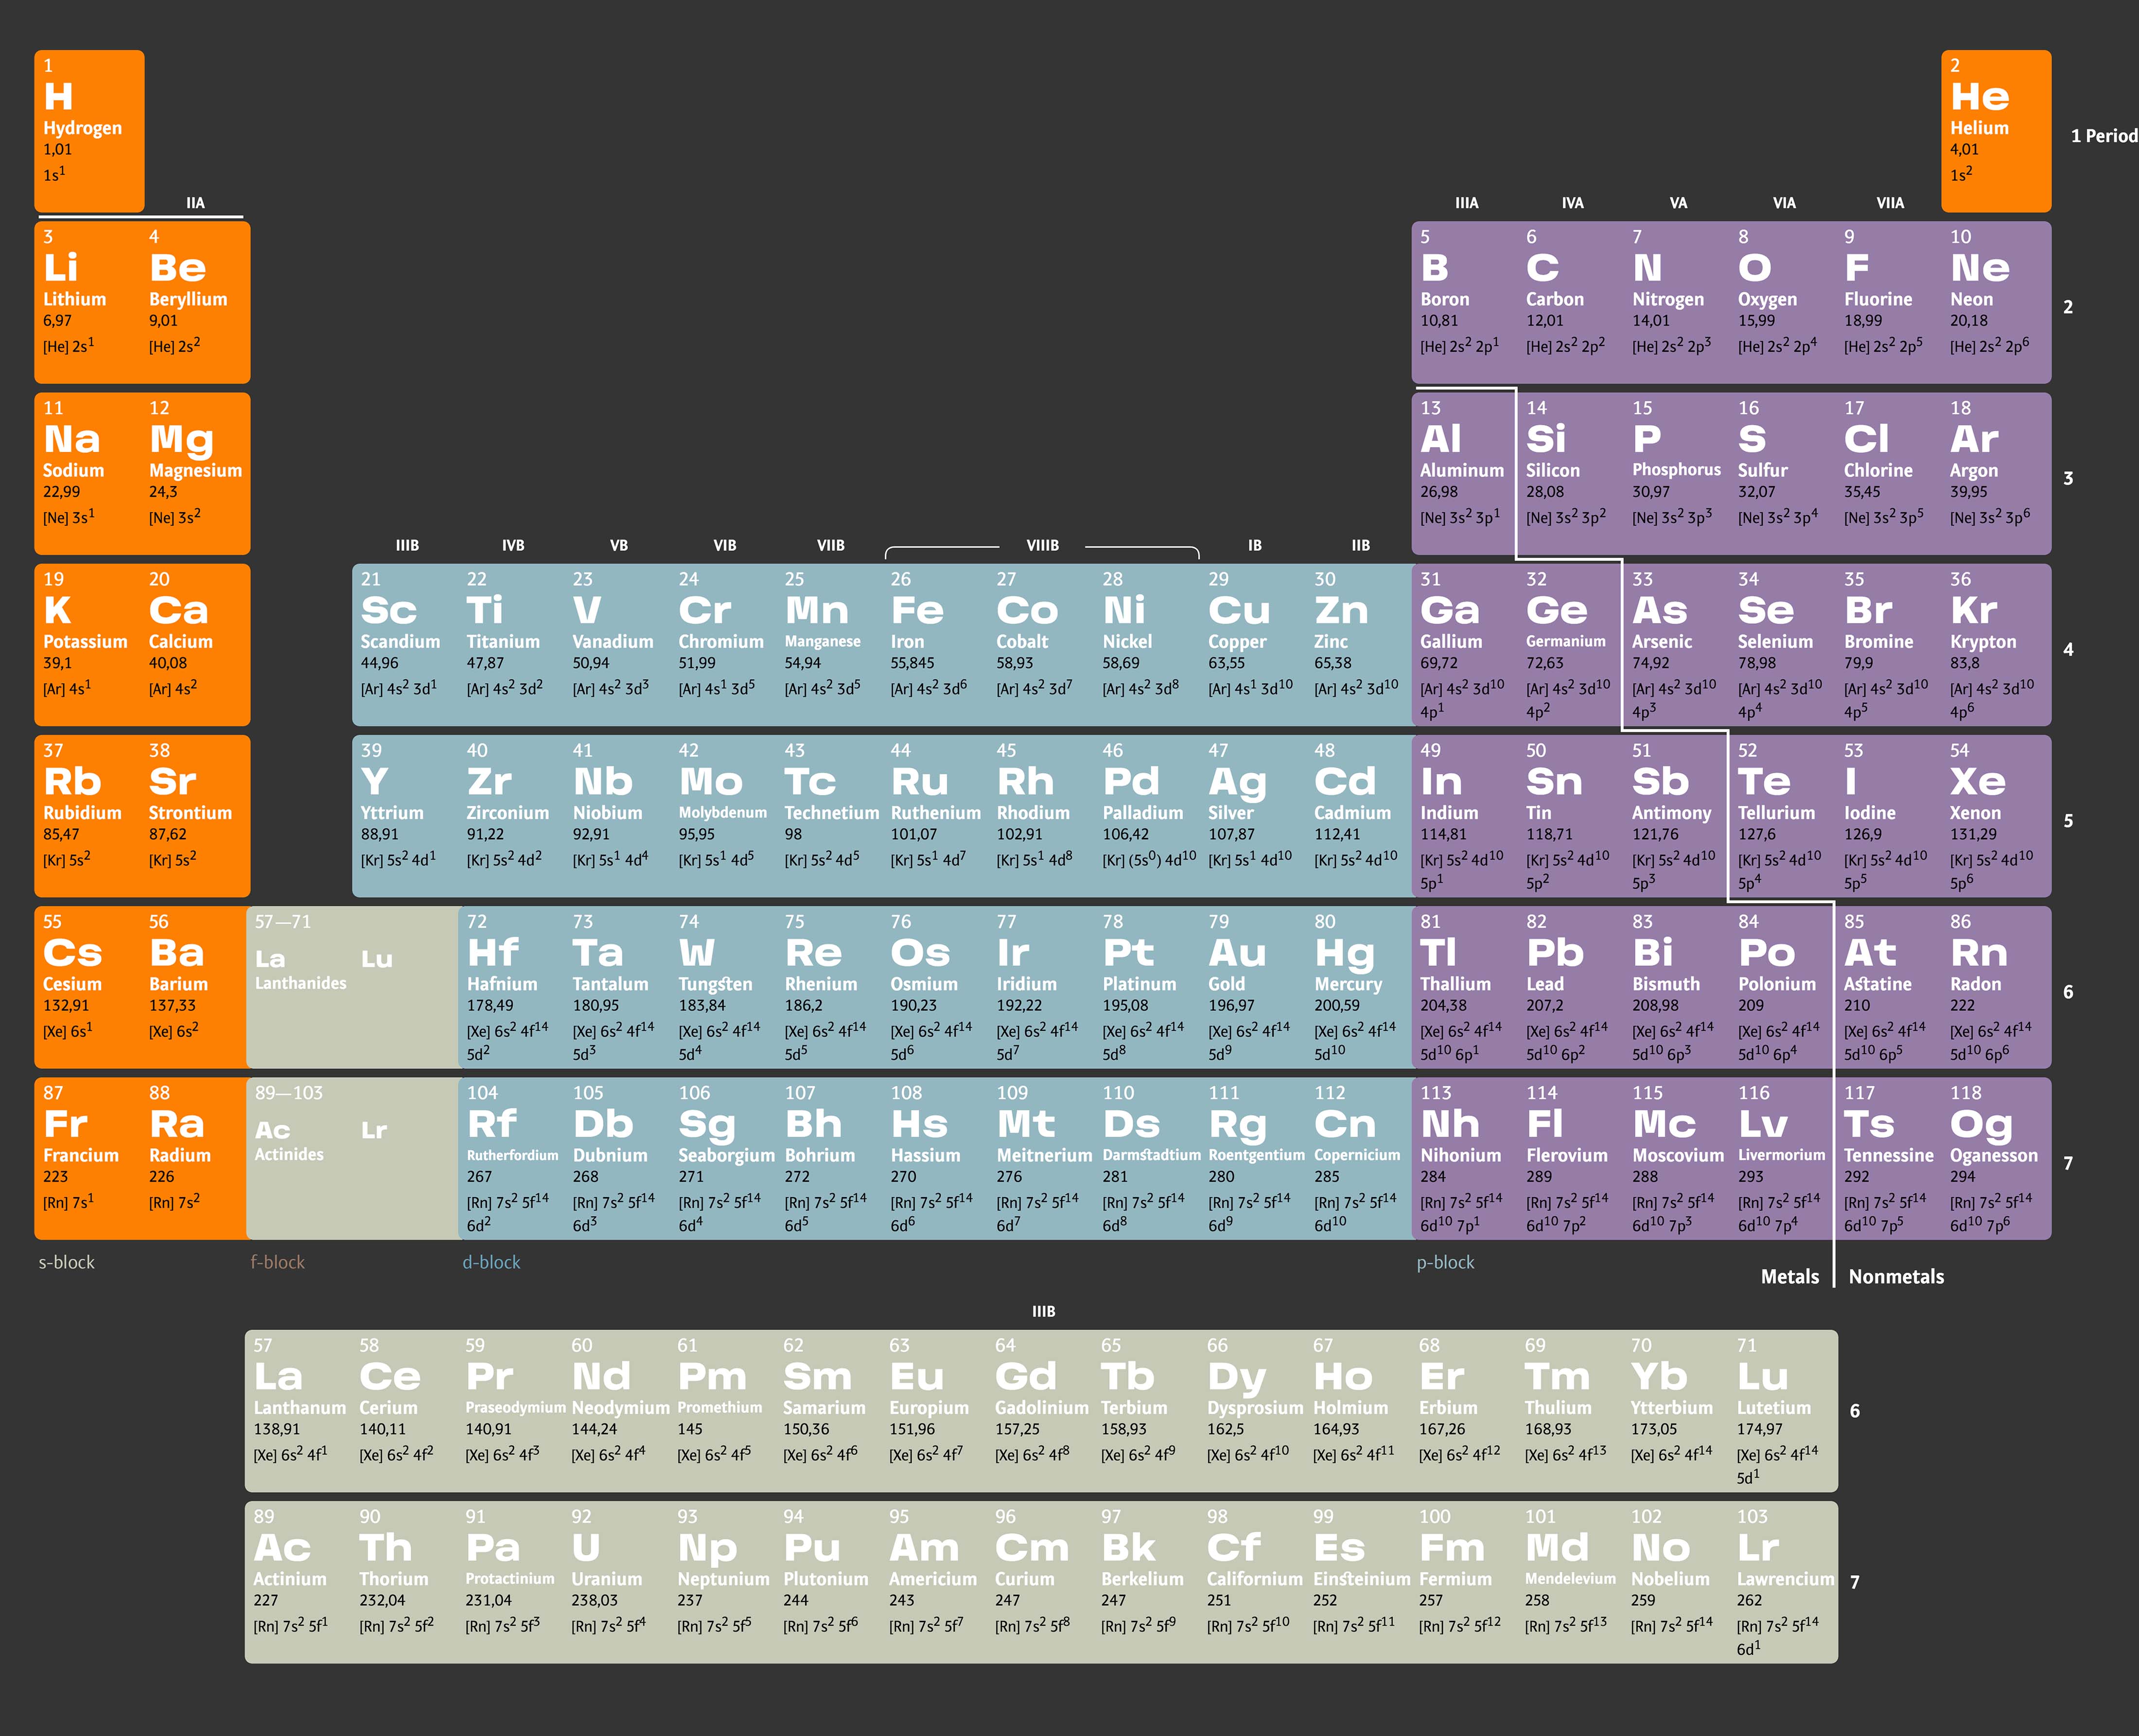
Our layout draws on a database of parameters to compile tables according to each user’s needs. The database covers 30 characteristics including electronic and nuclear, physical properties, occurrence in nature, discovery, and classification.

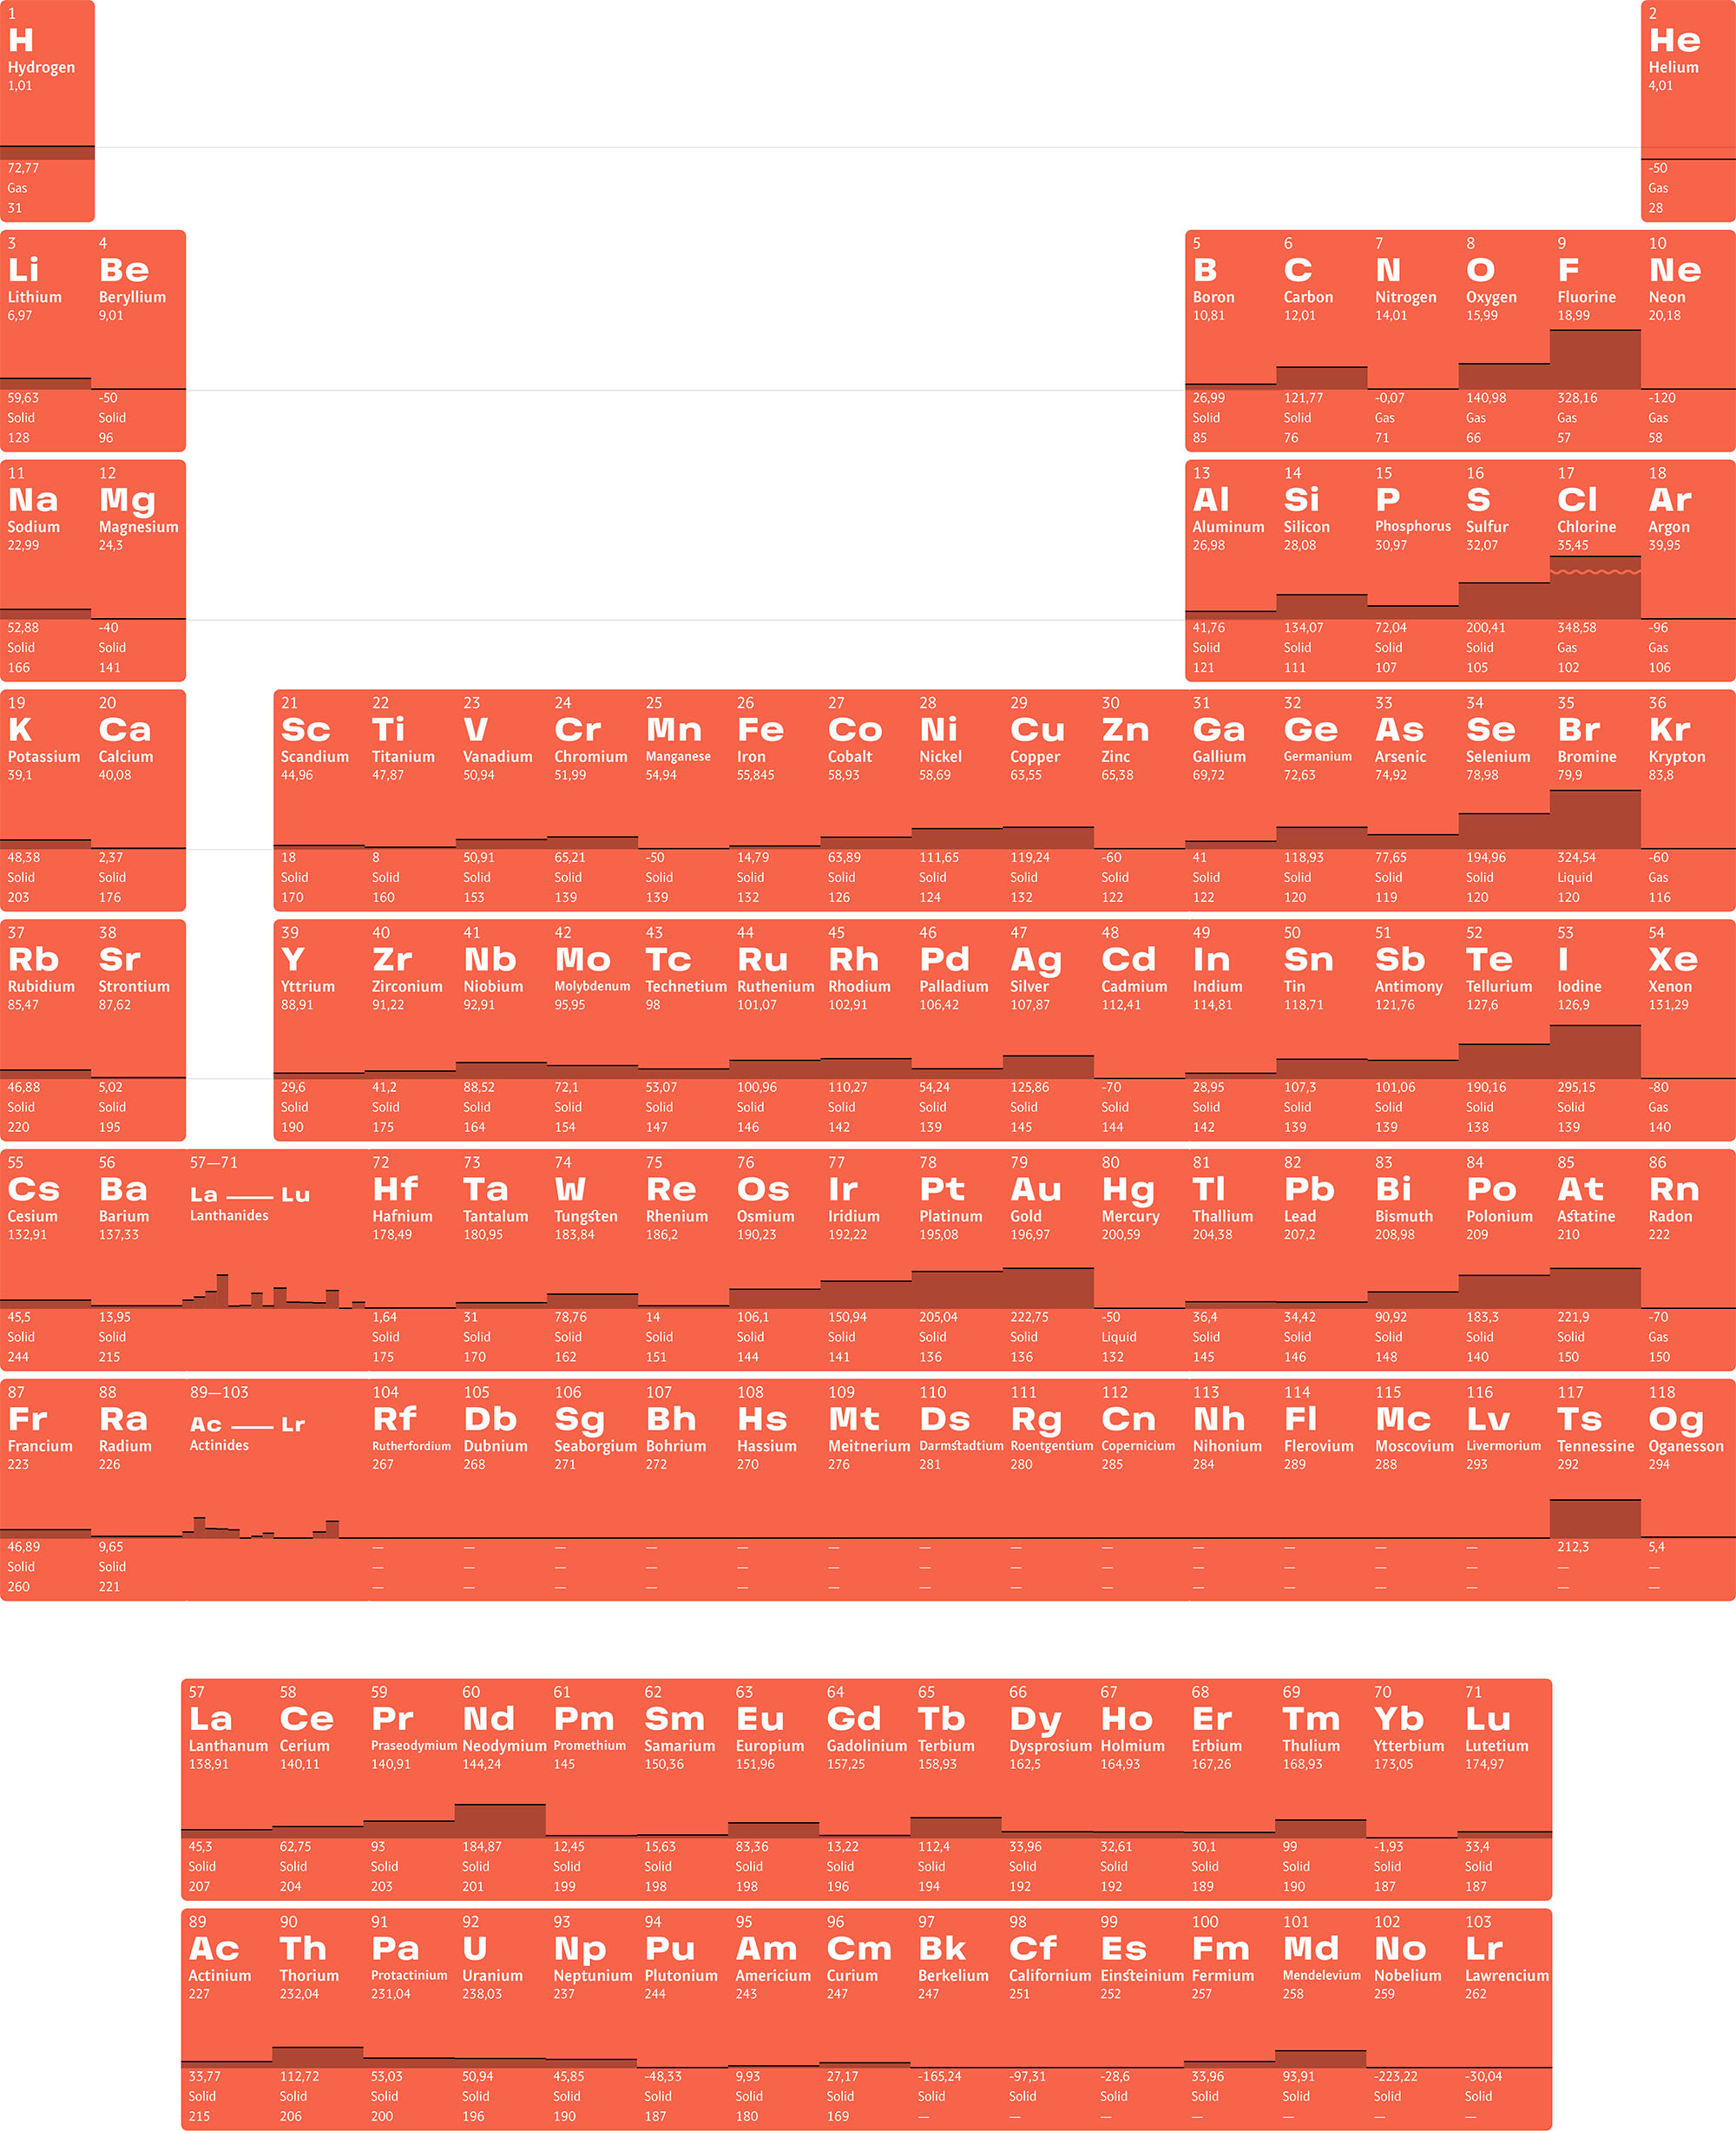
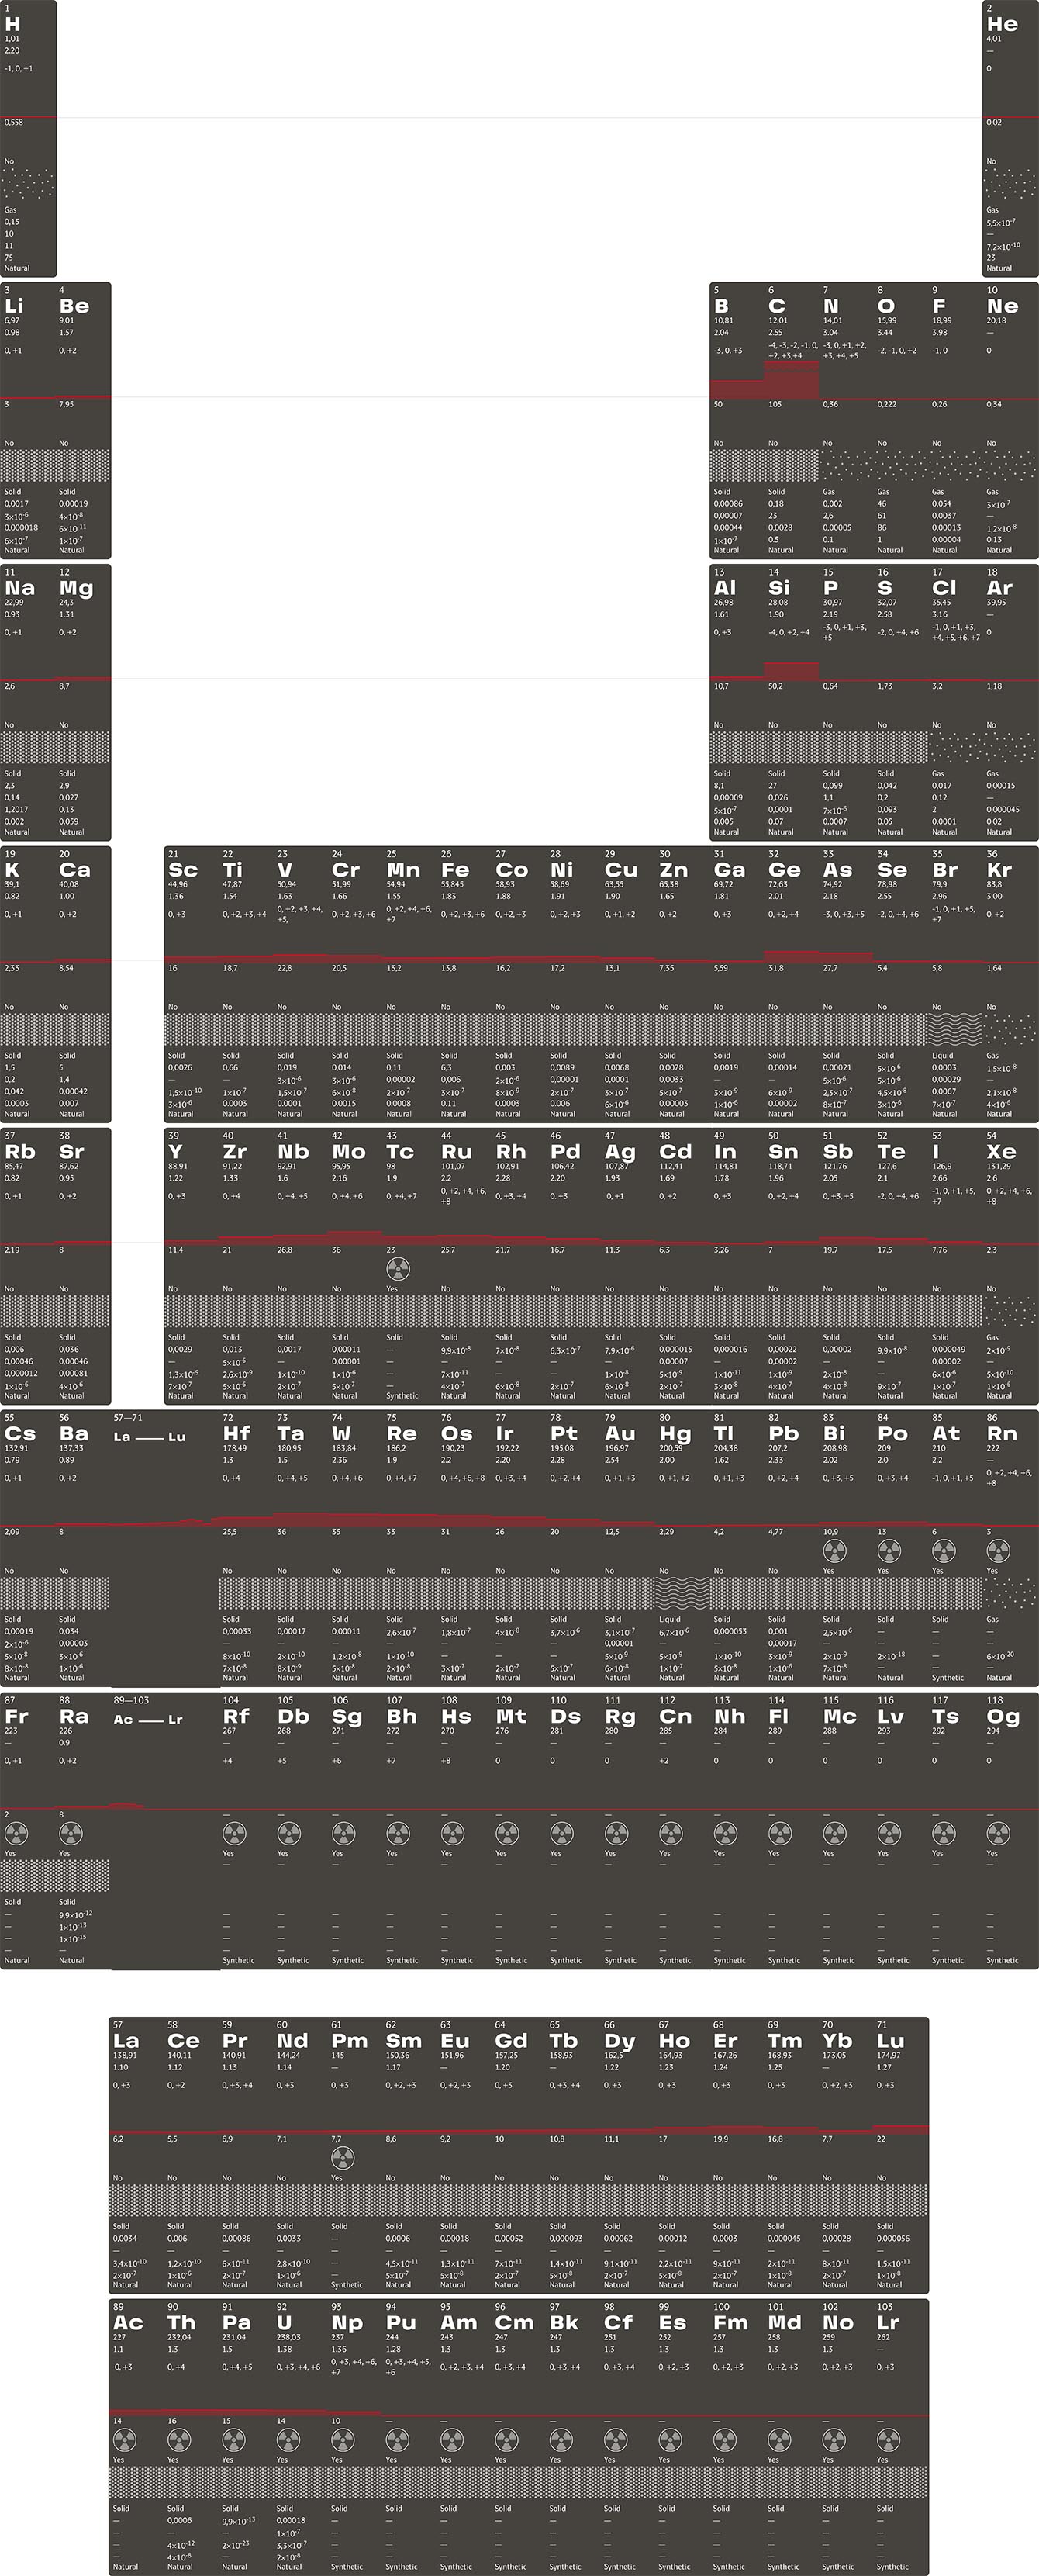
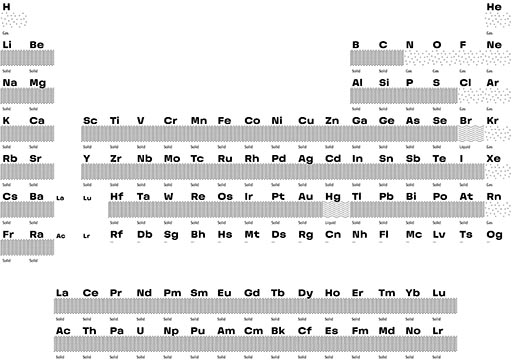
Not just numbers
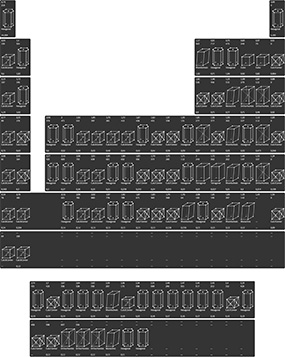
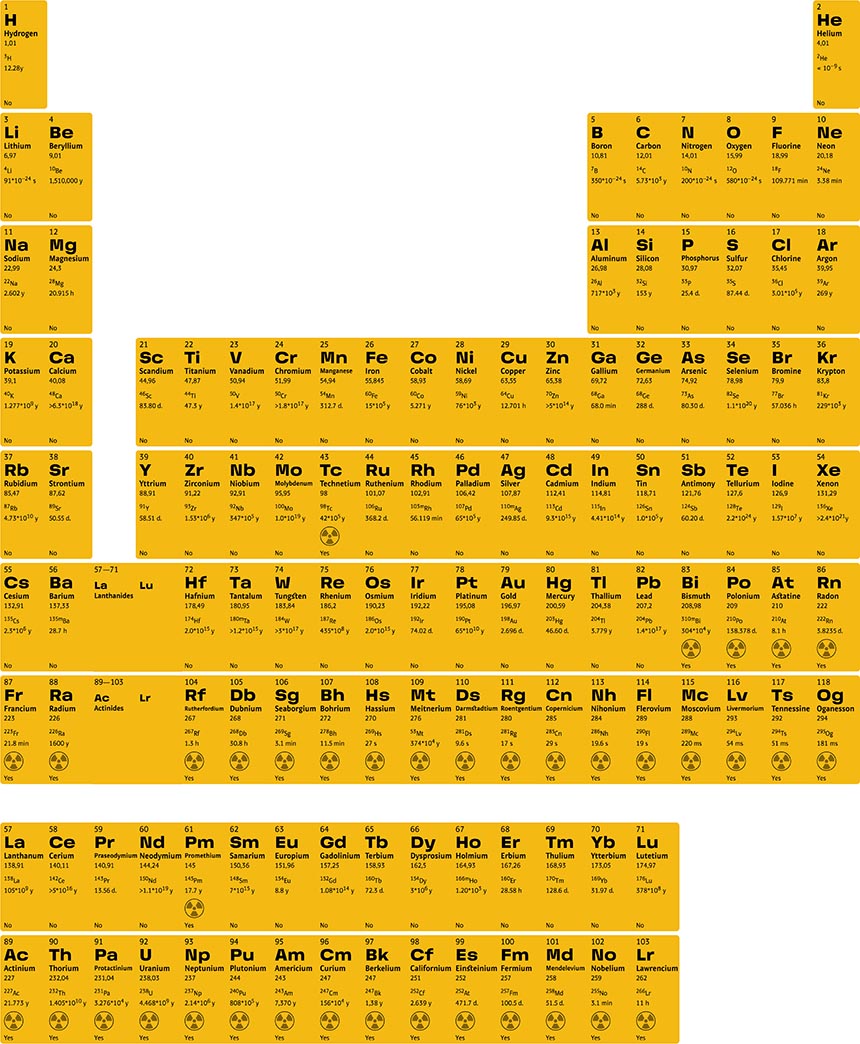
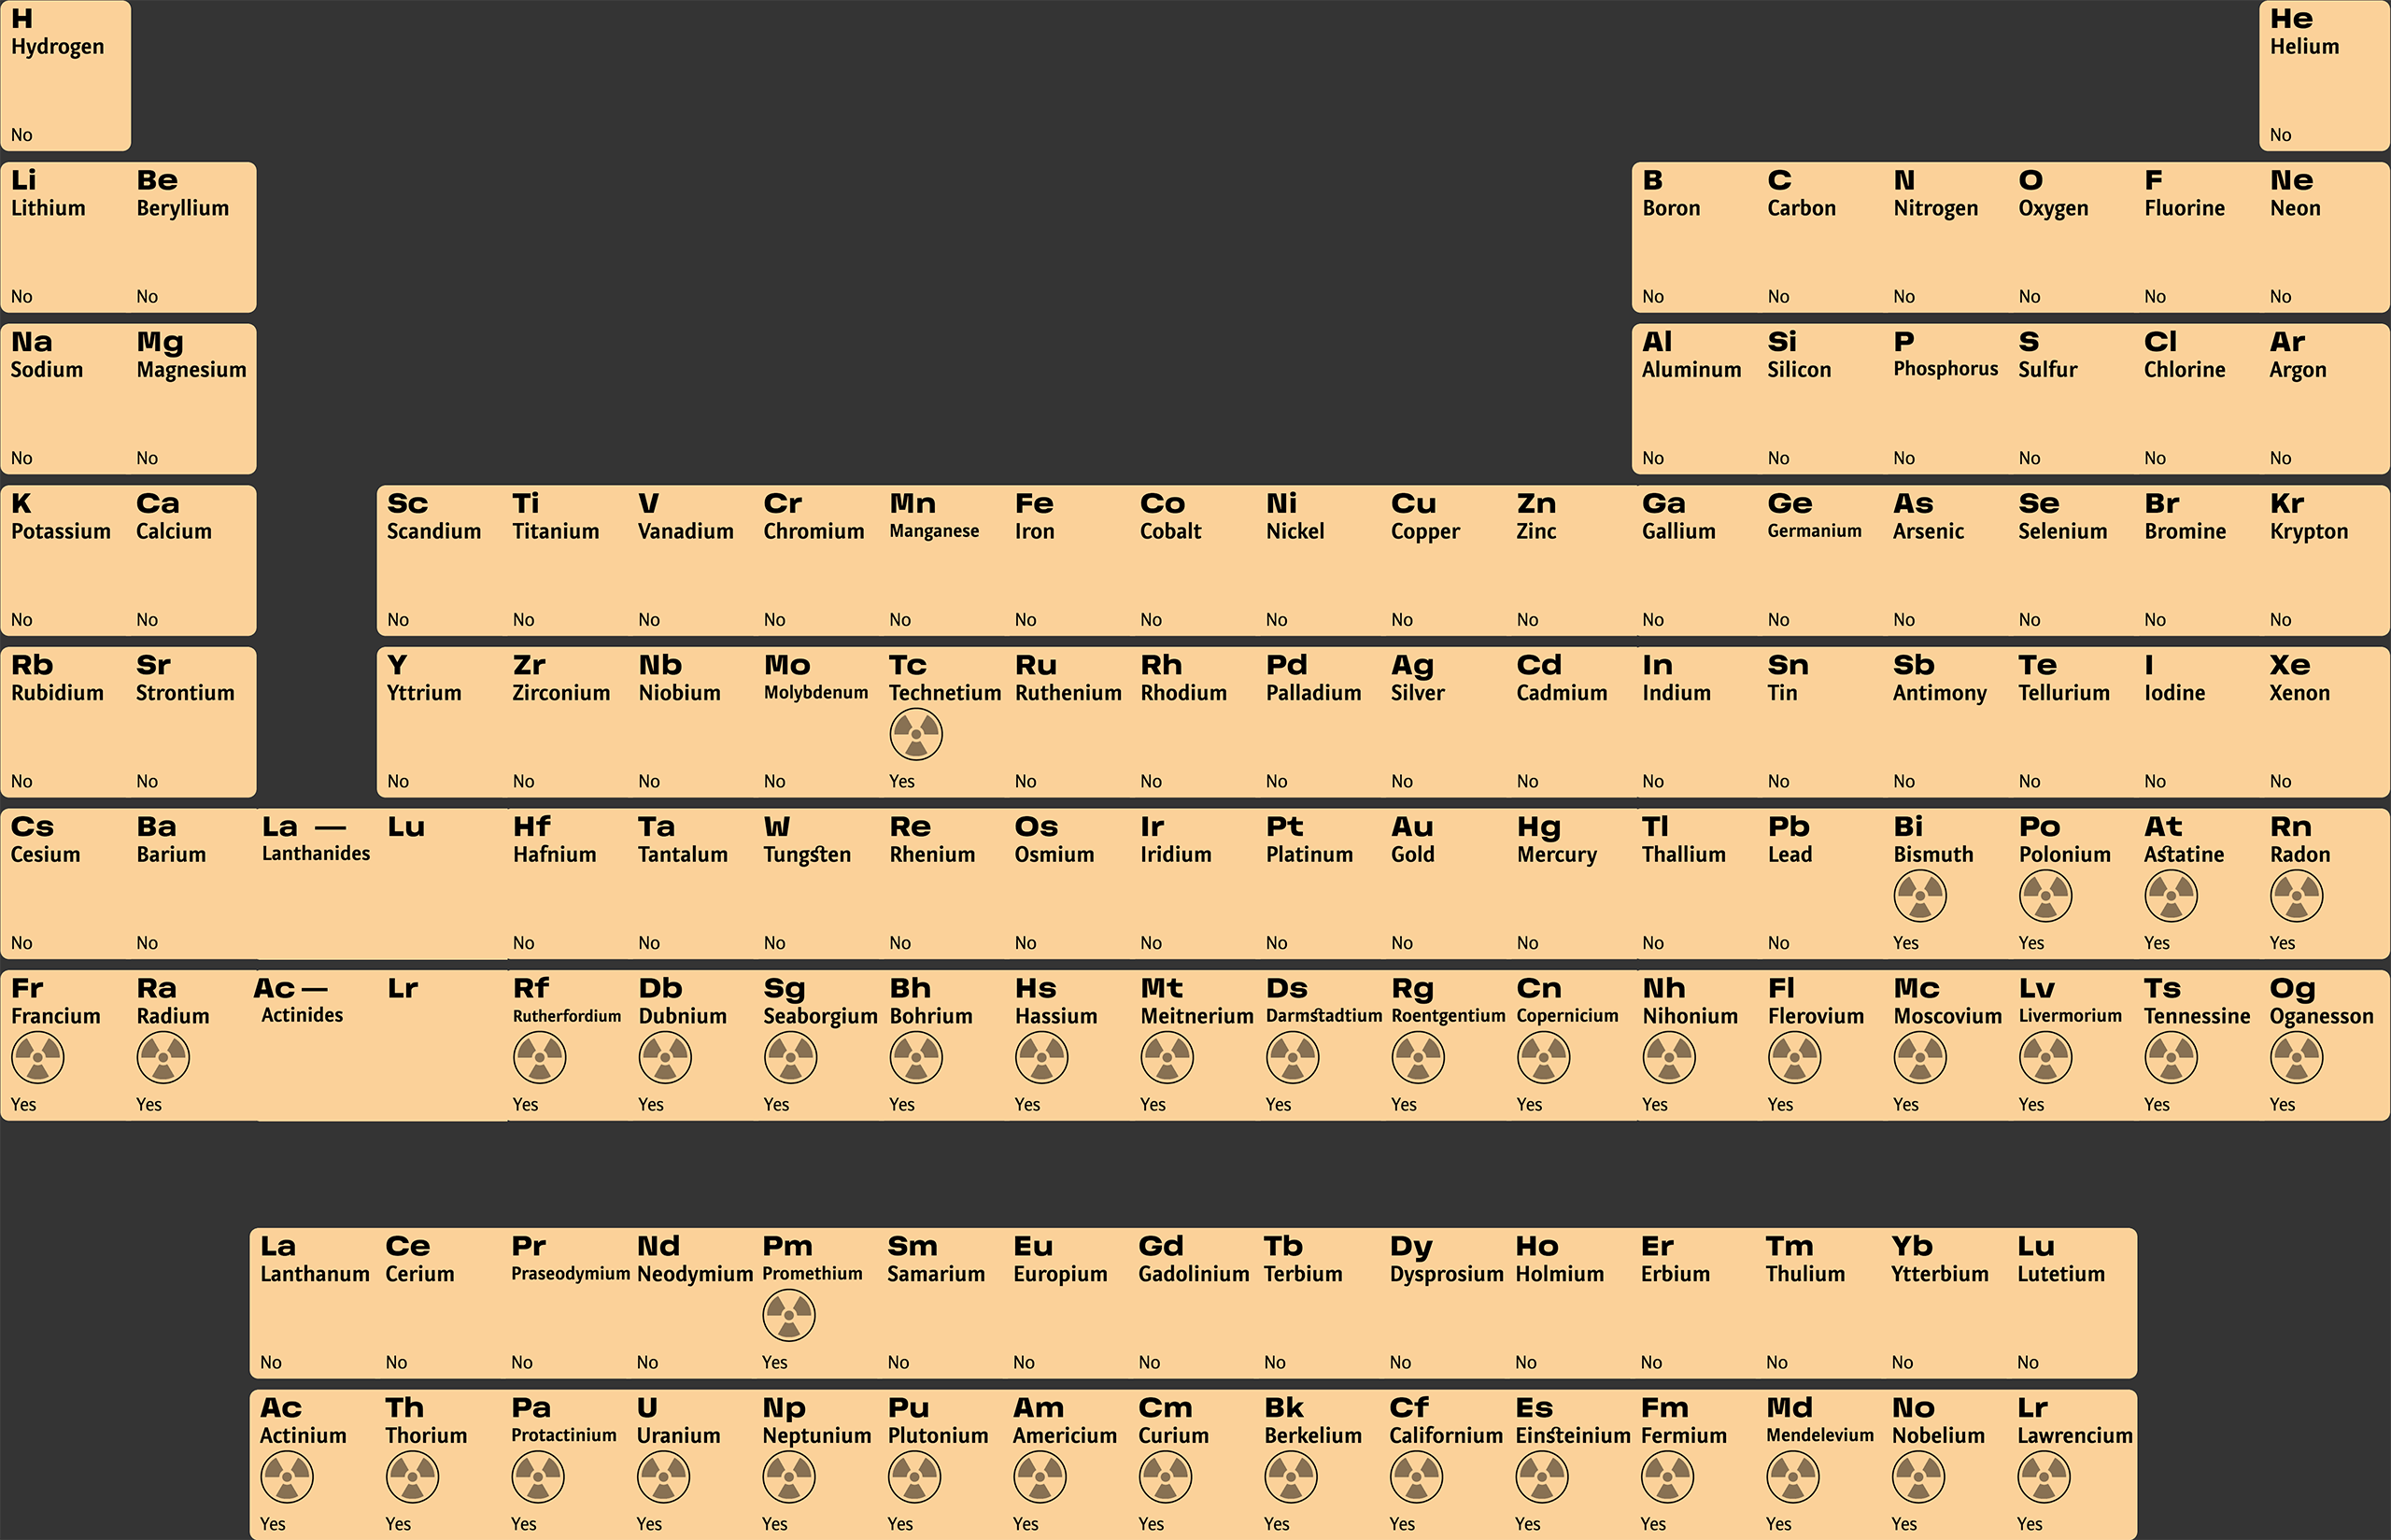
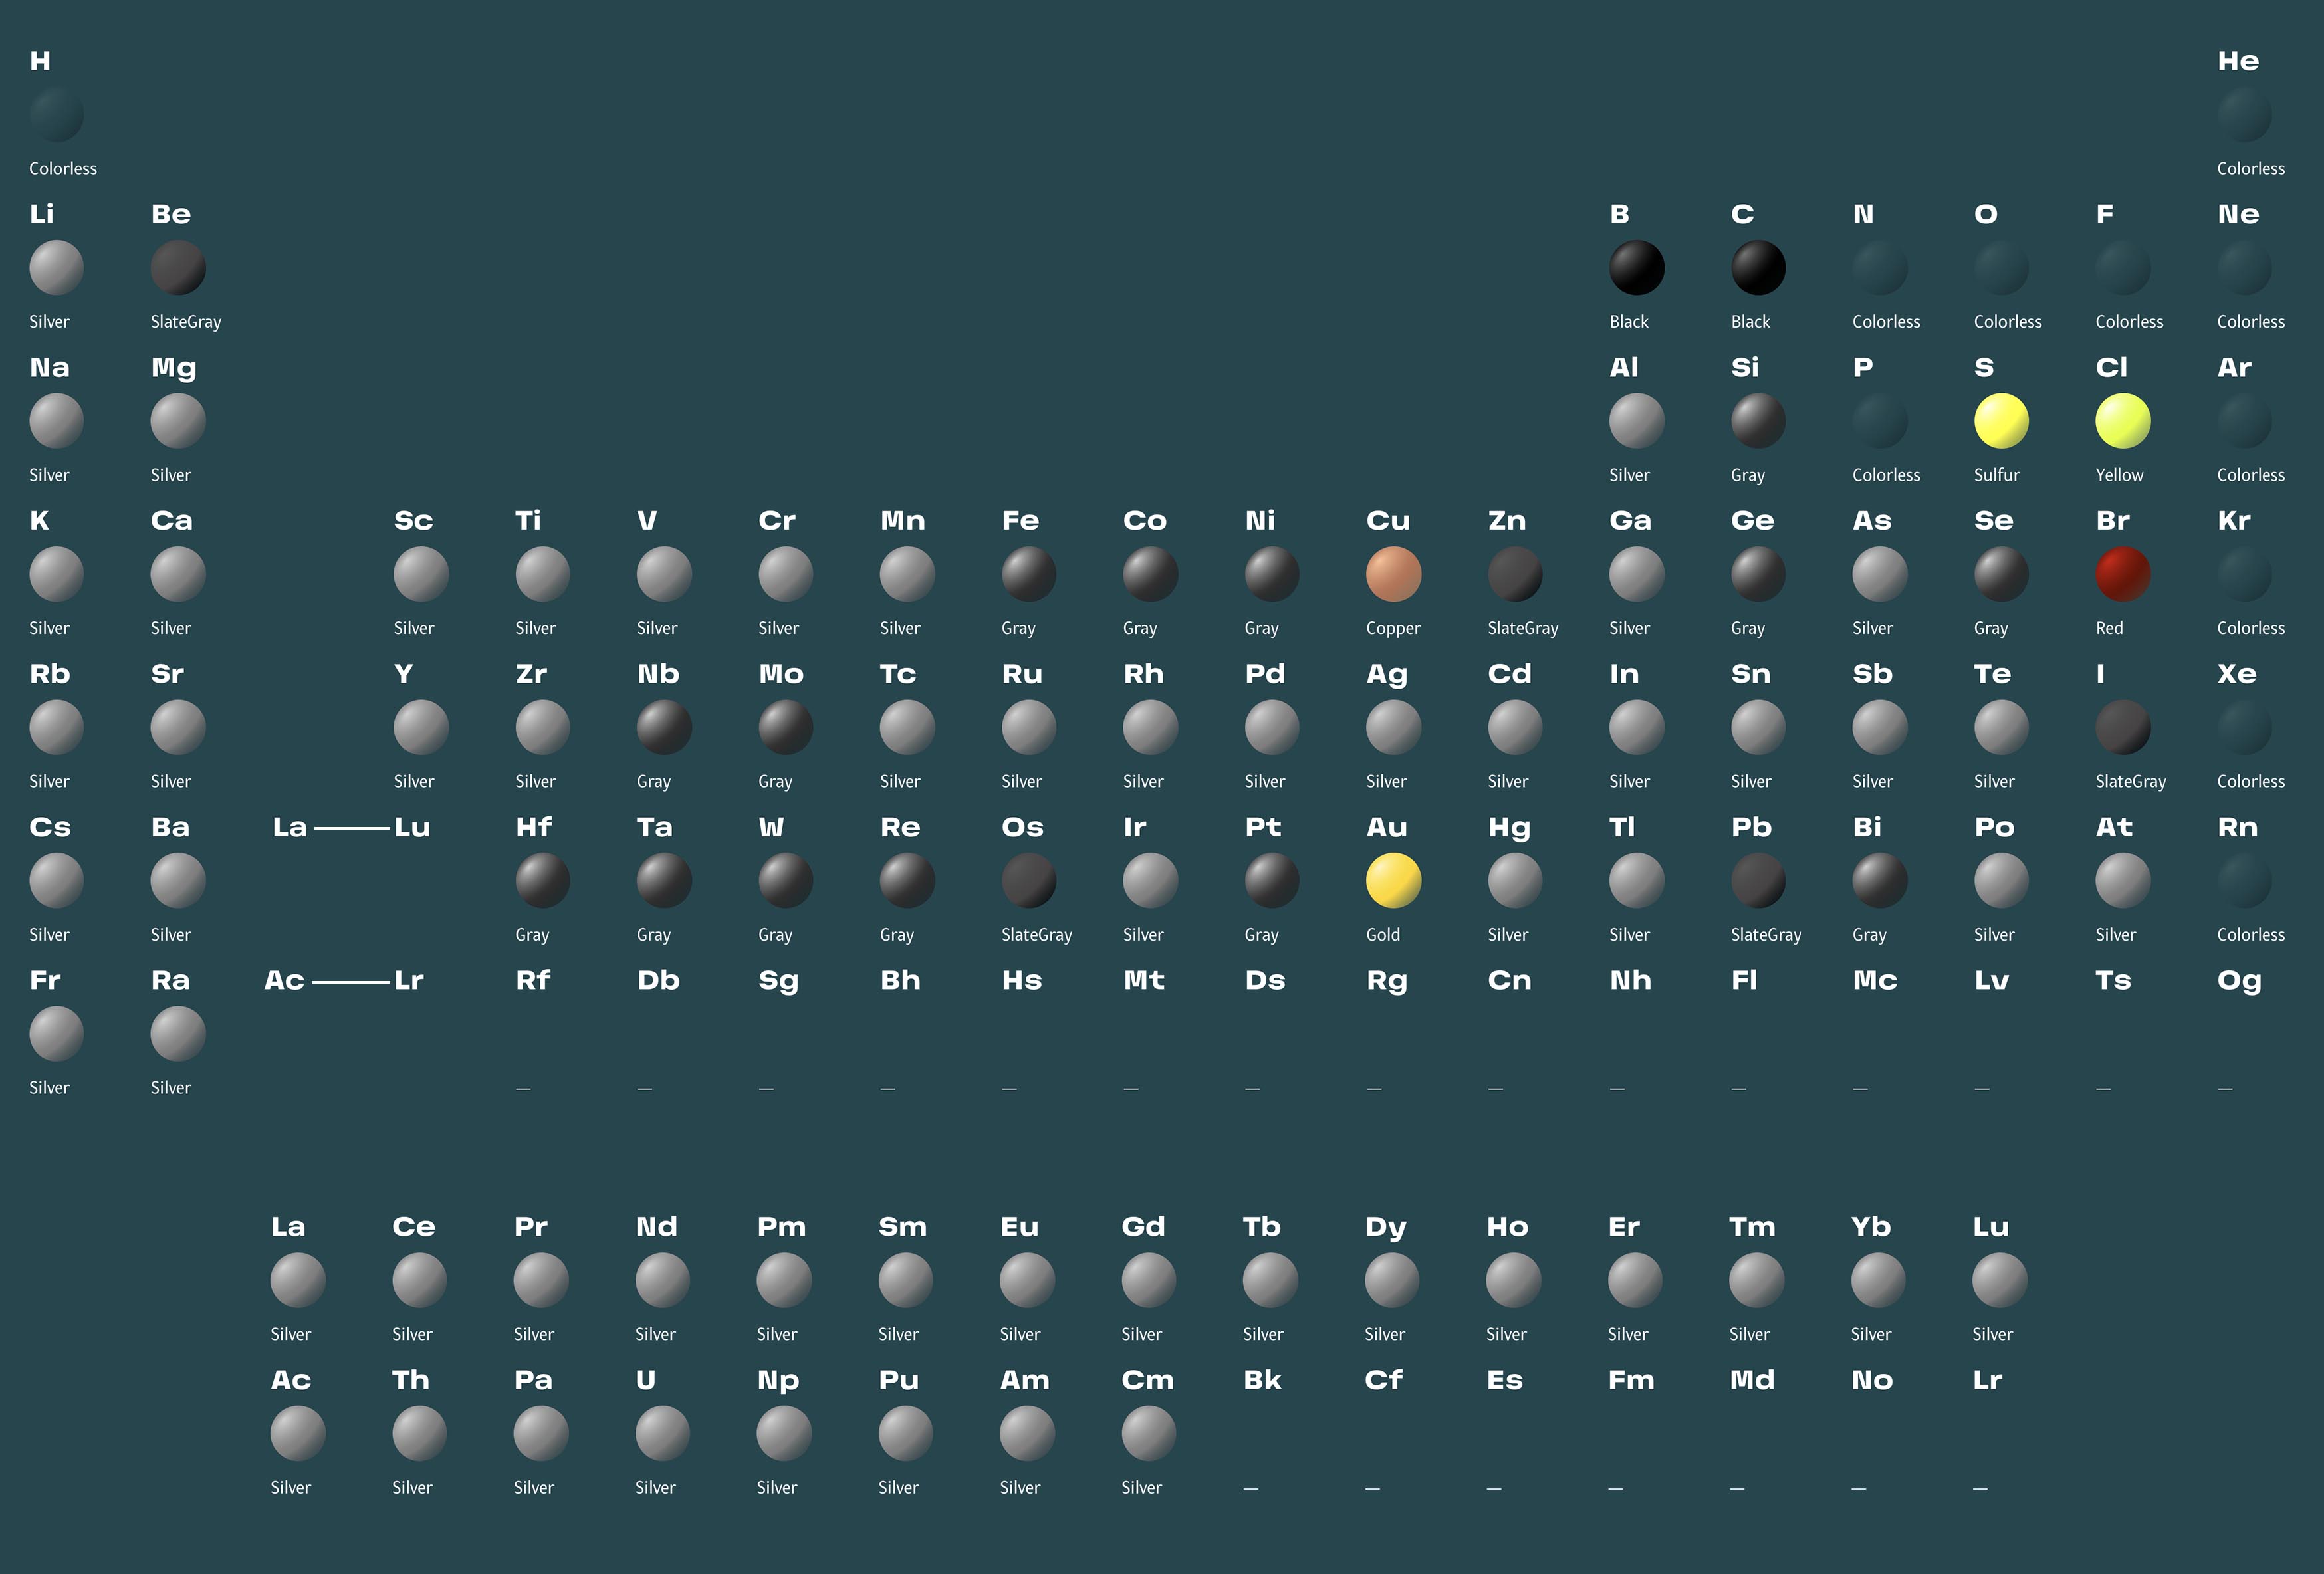
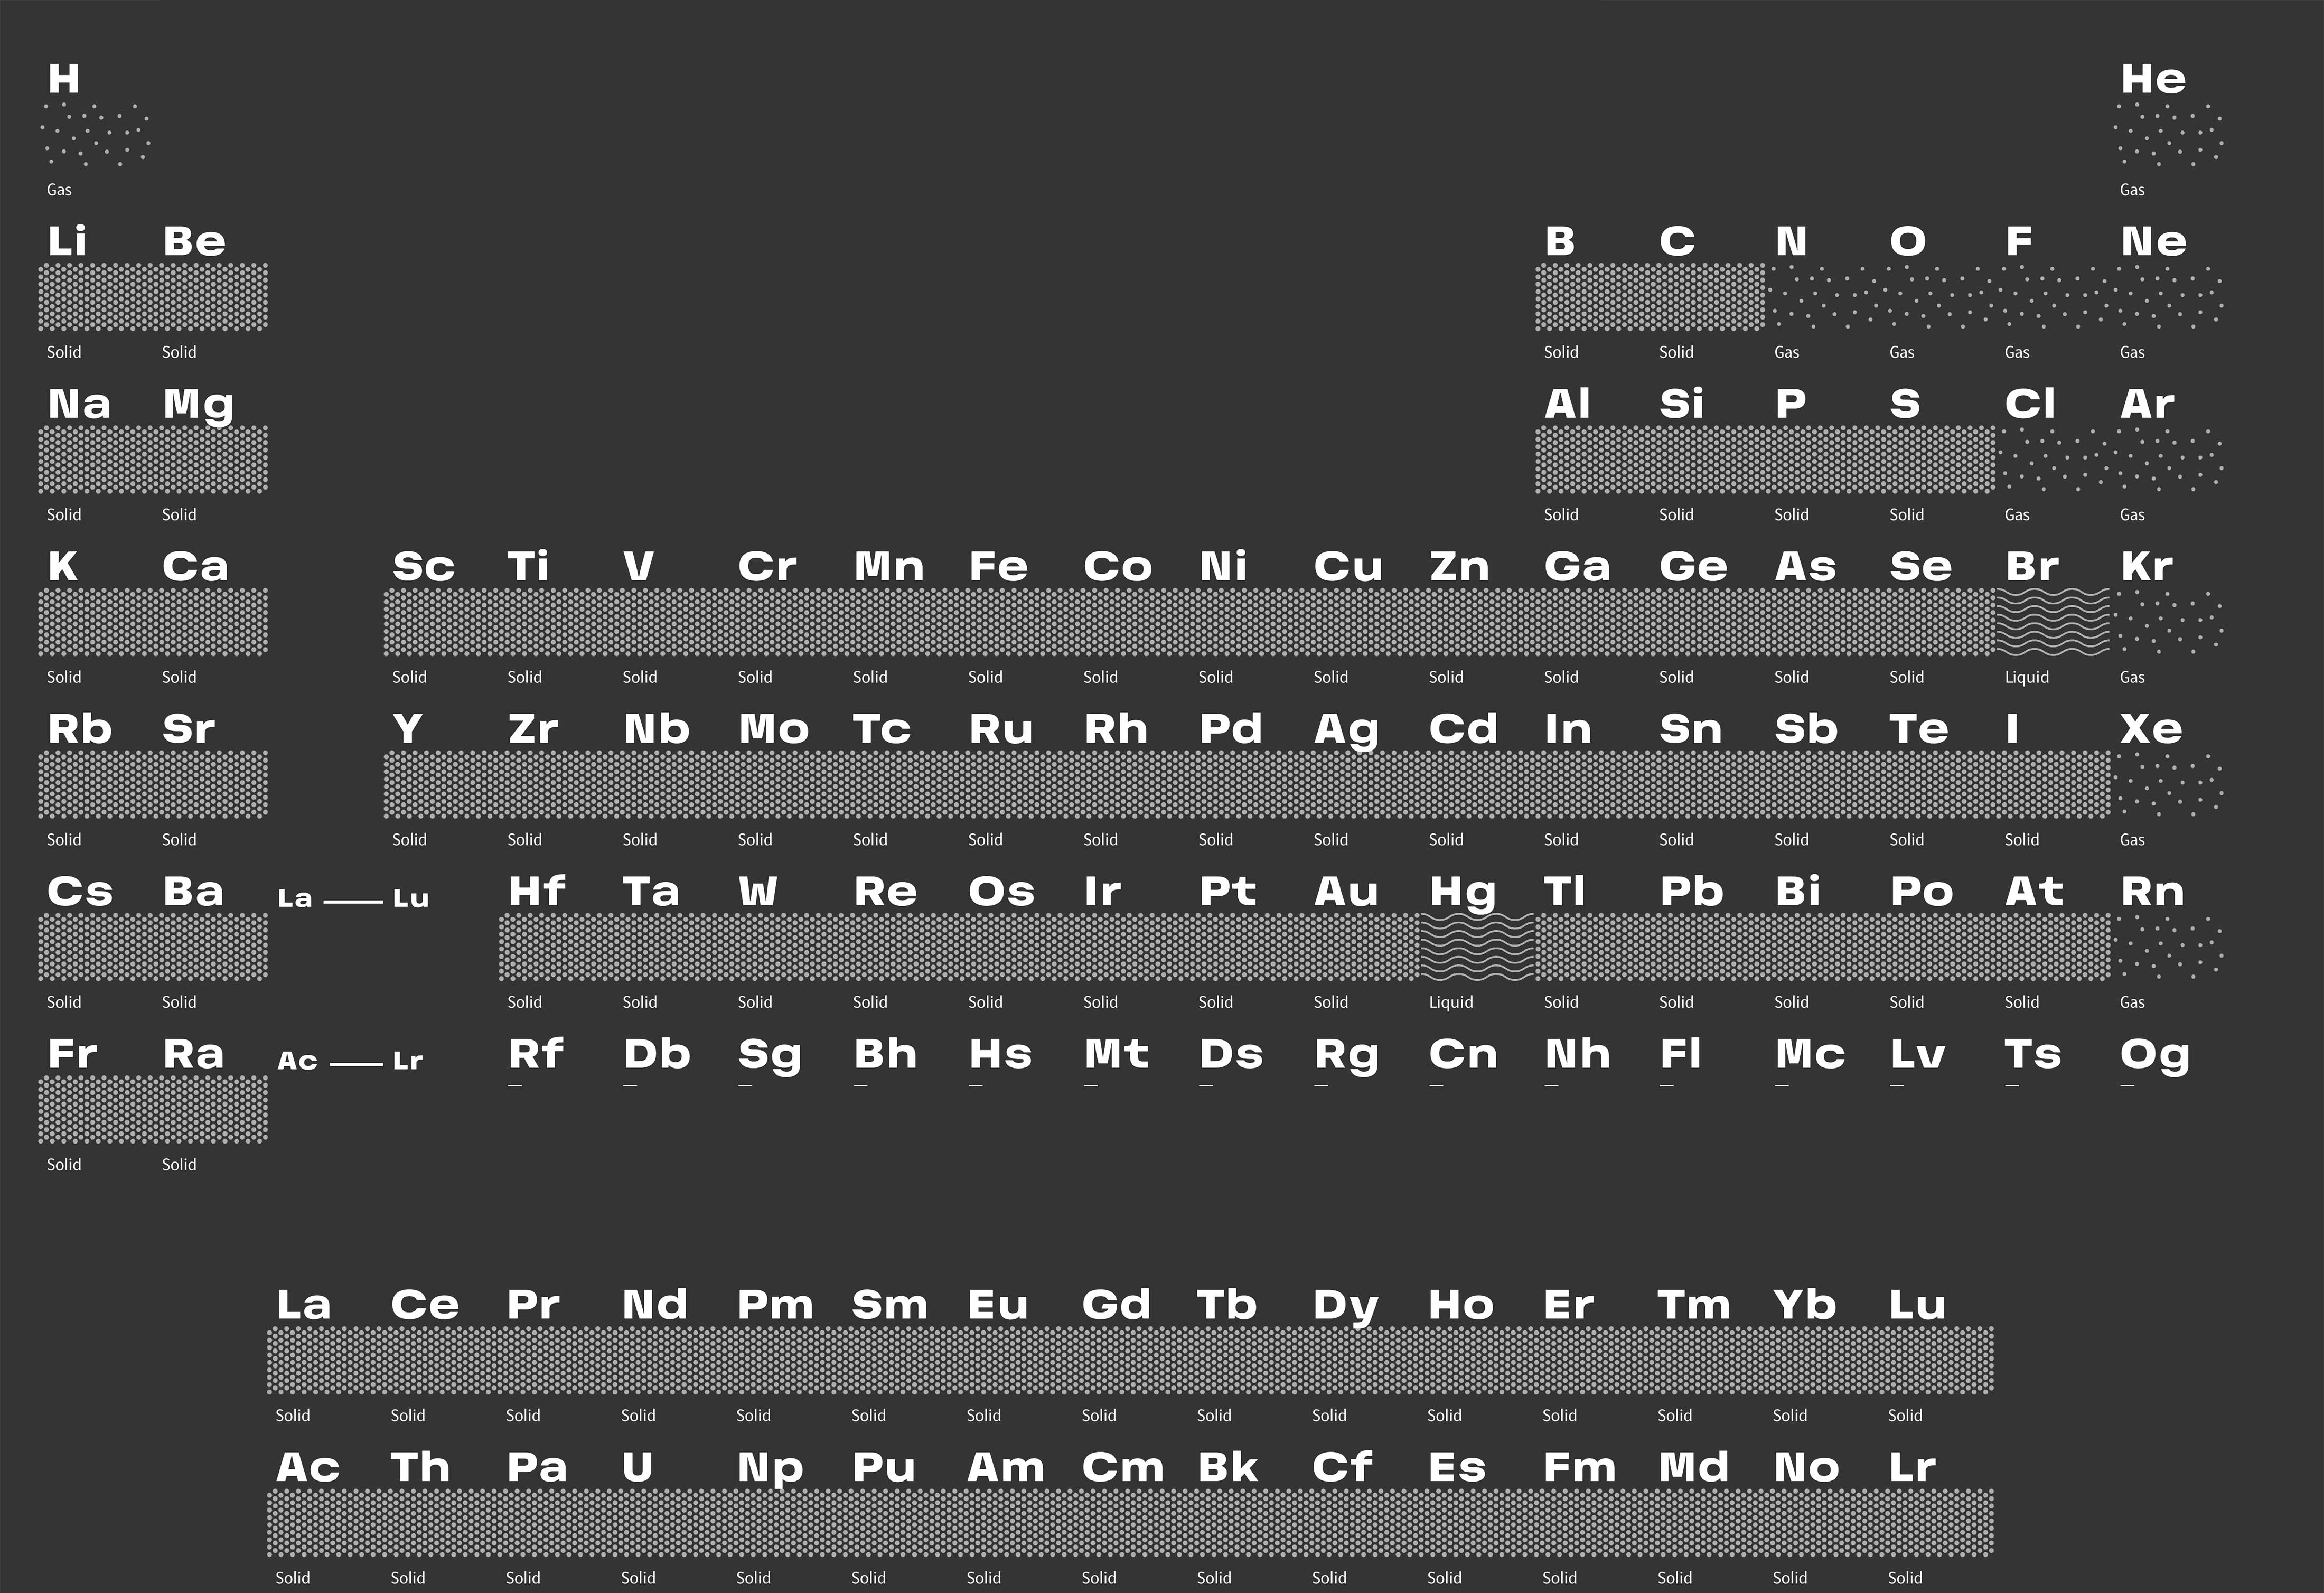
We created pictograms
for some parameters.
Radioactivity
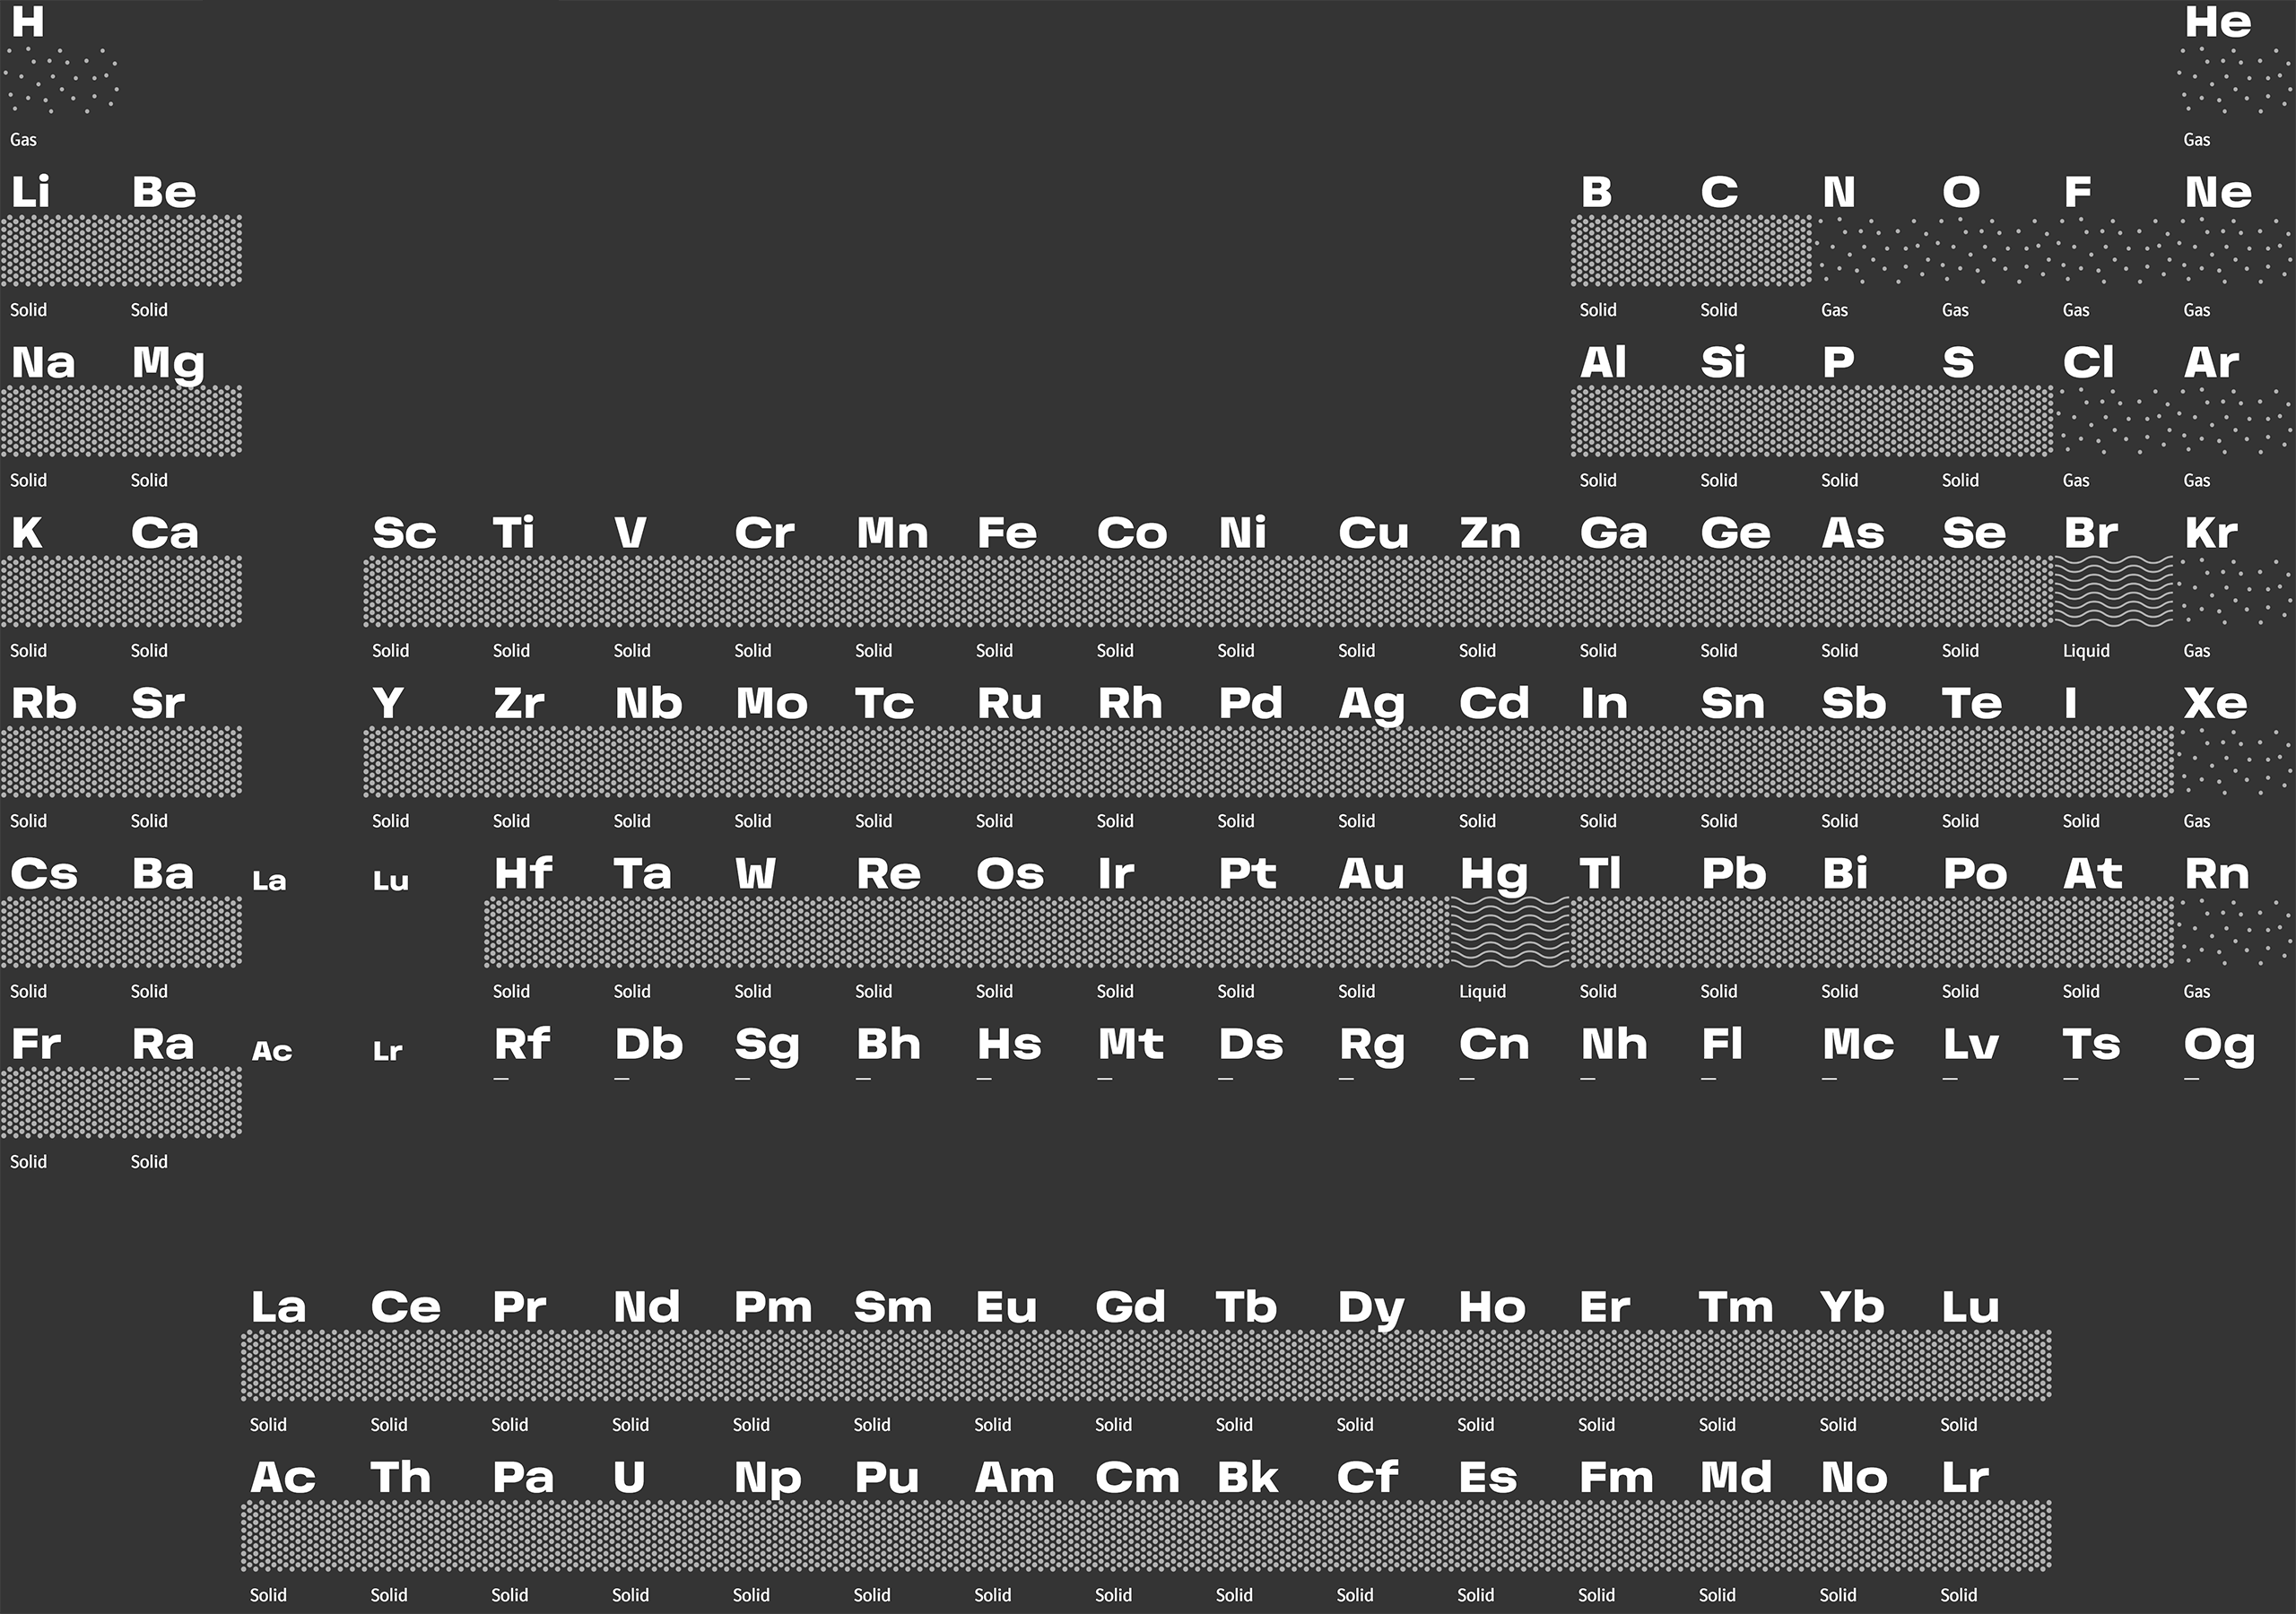
State of matter
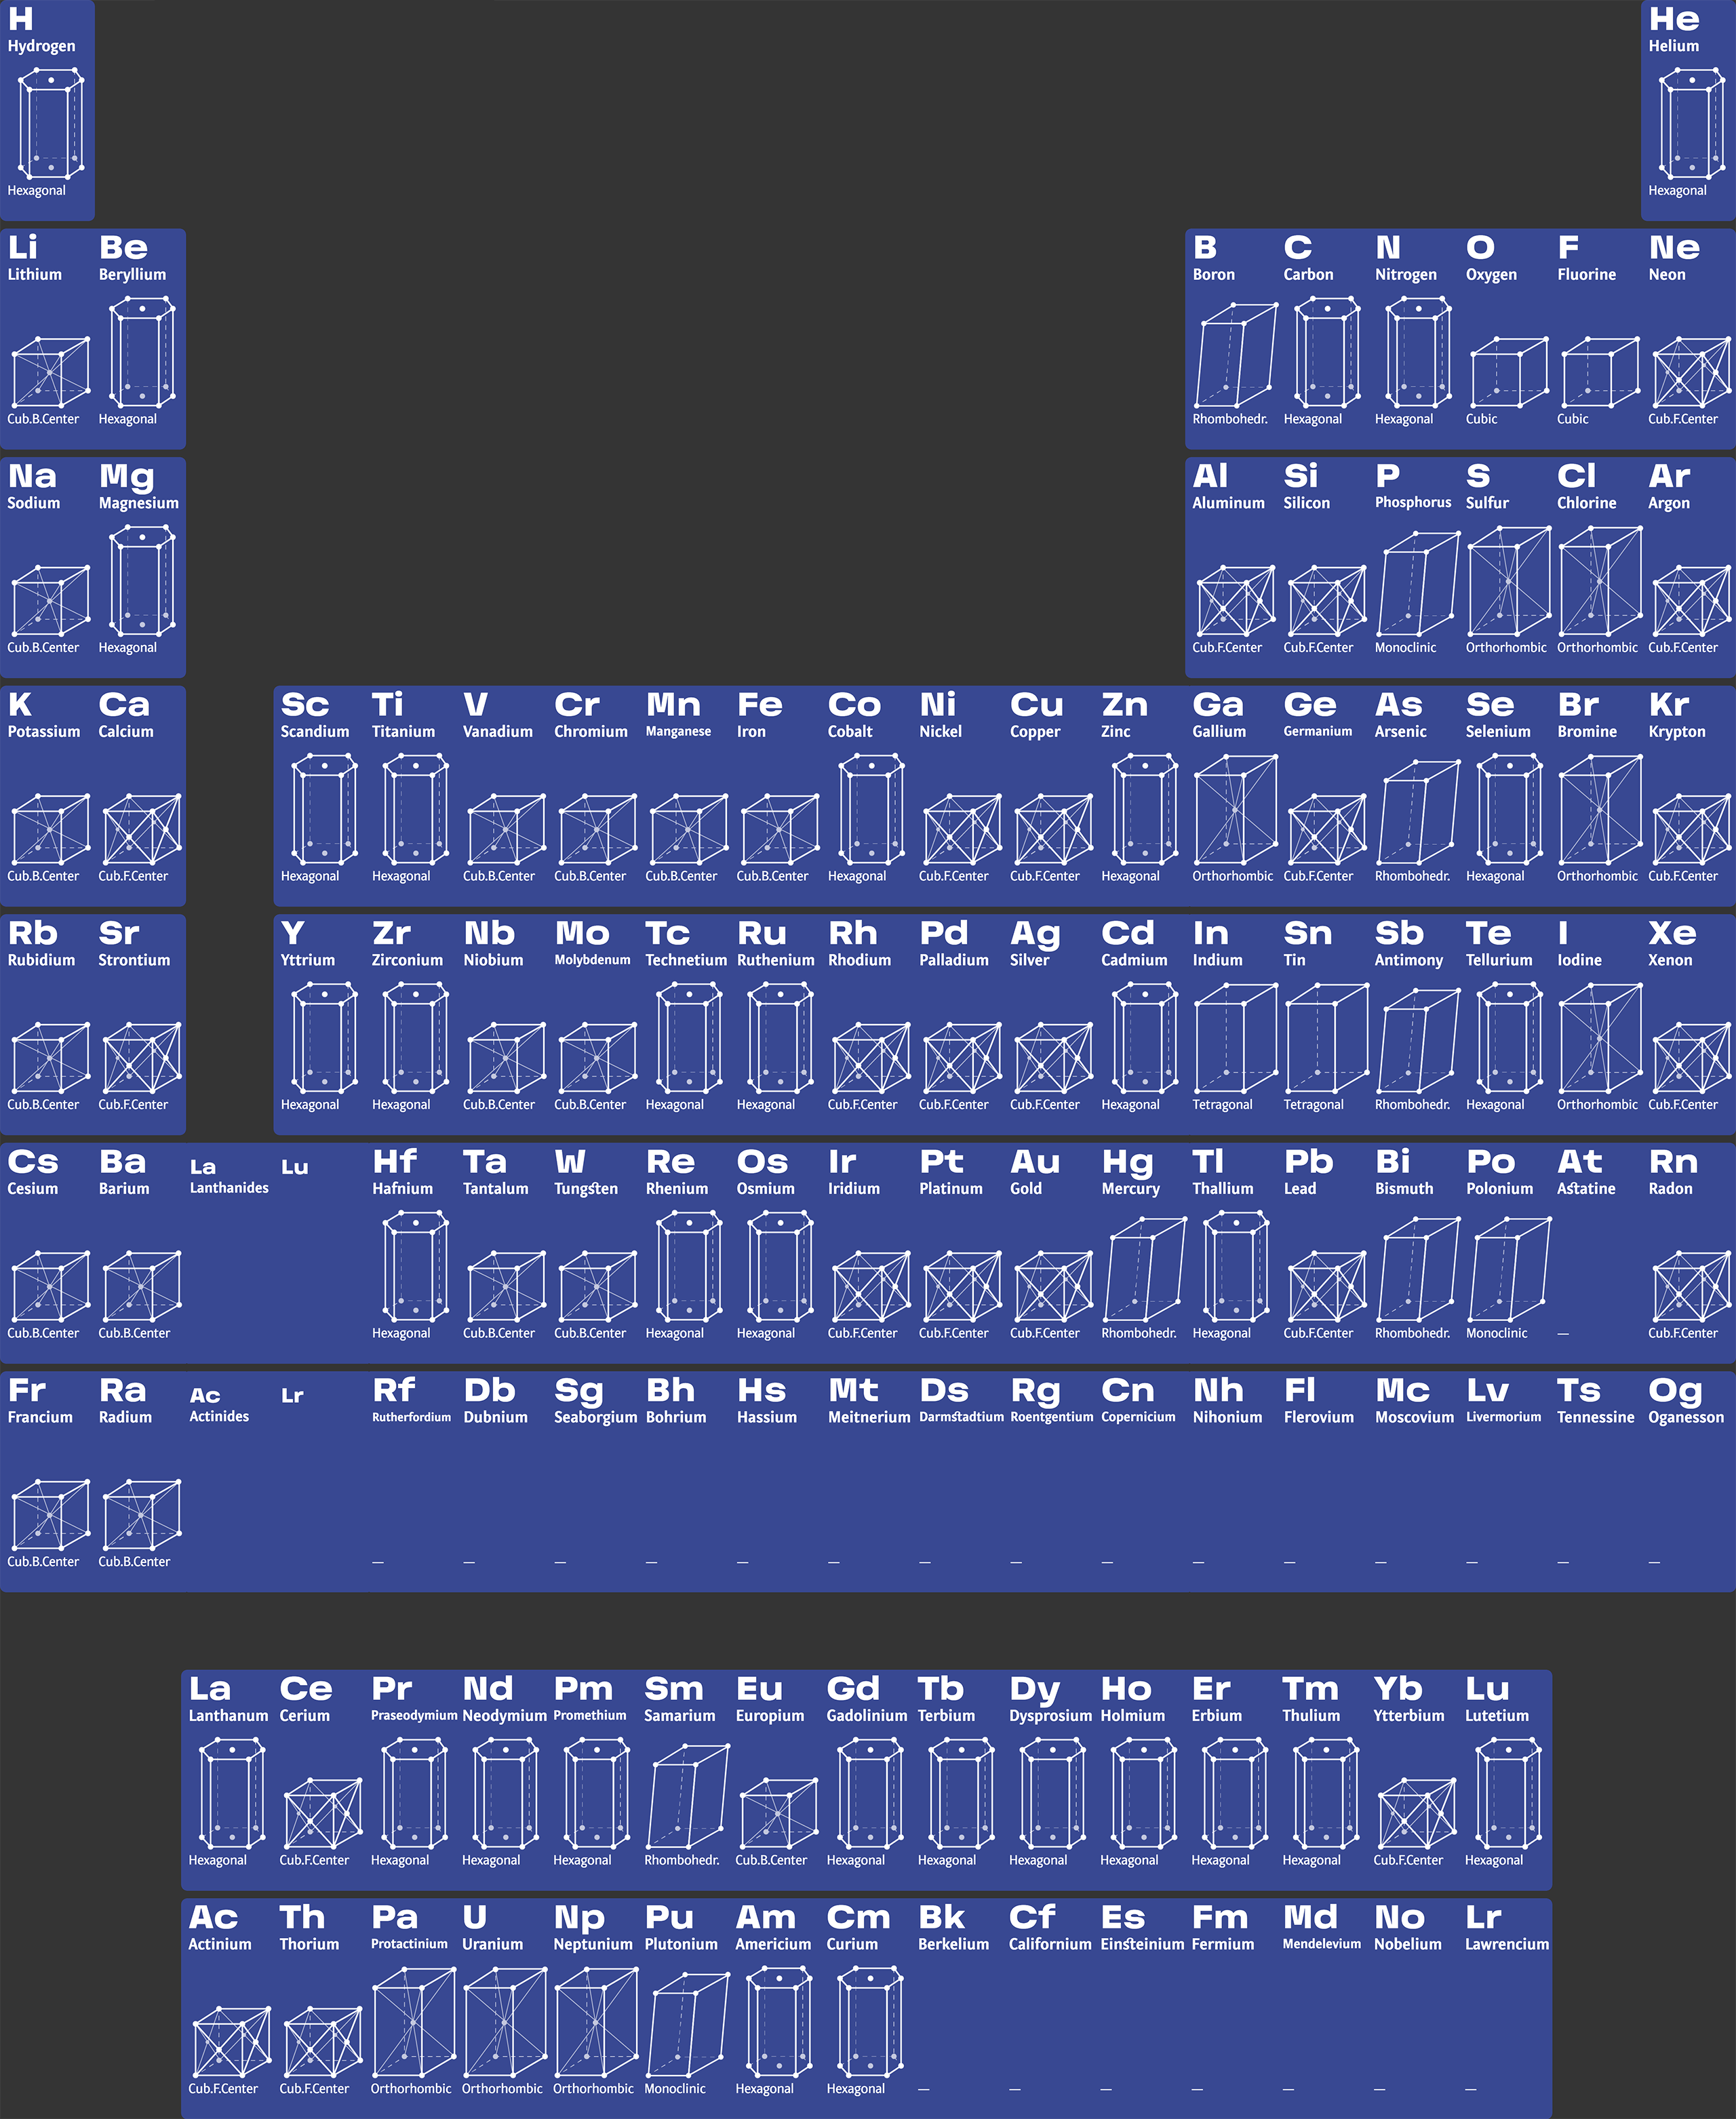
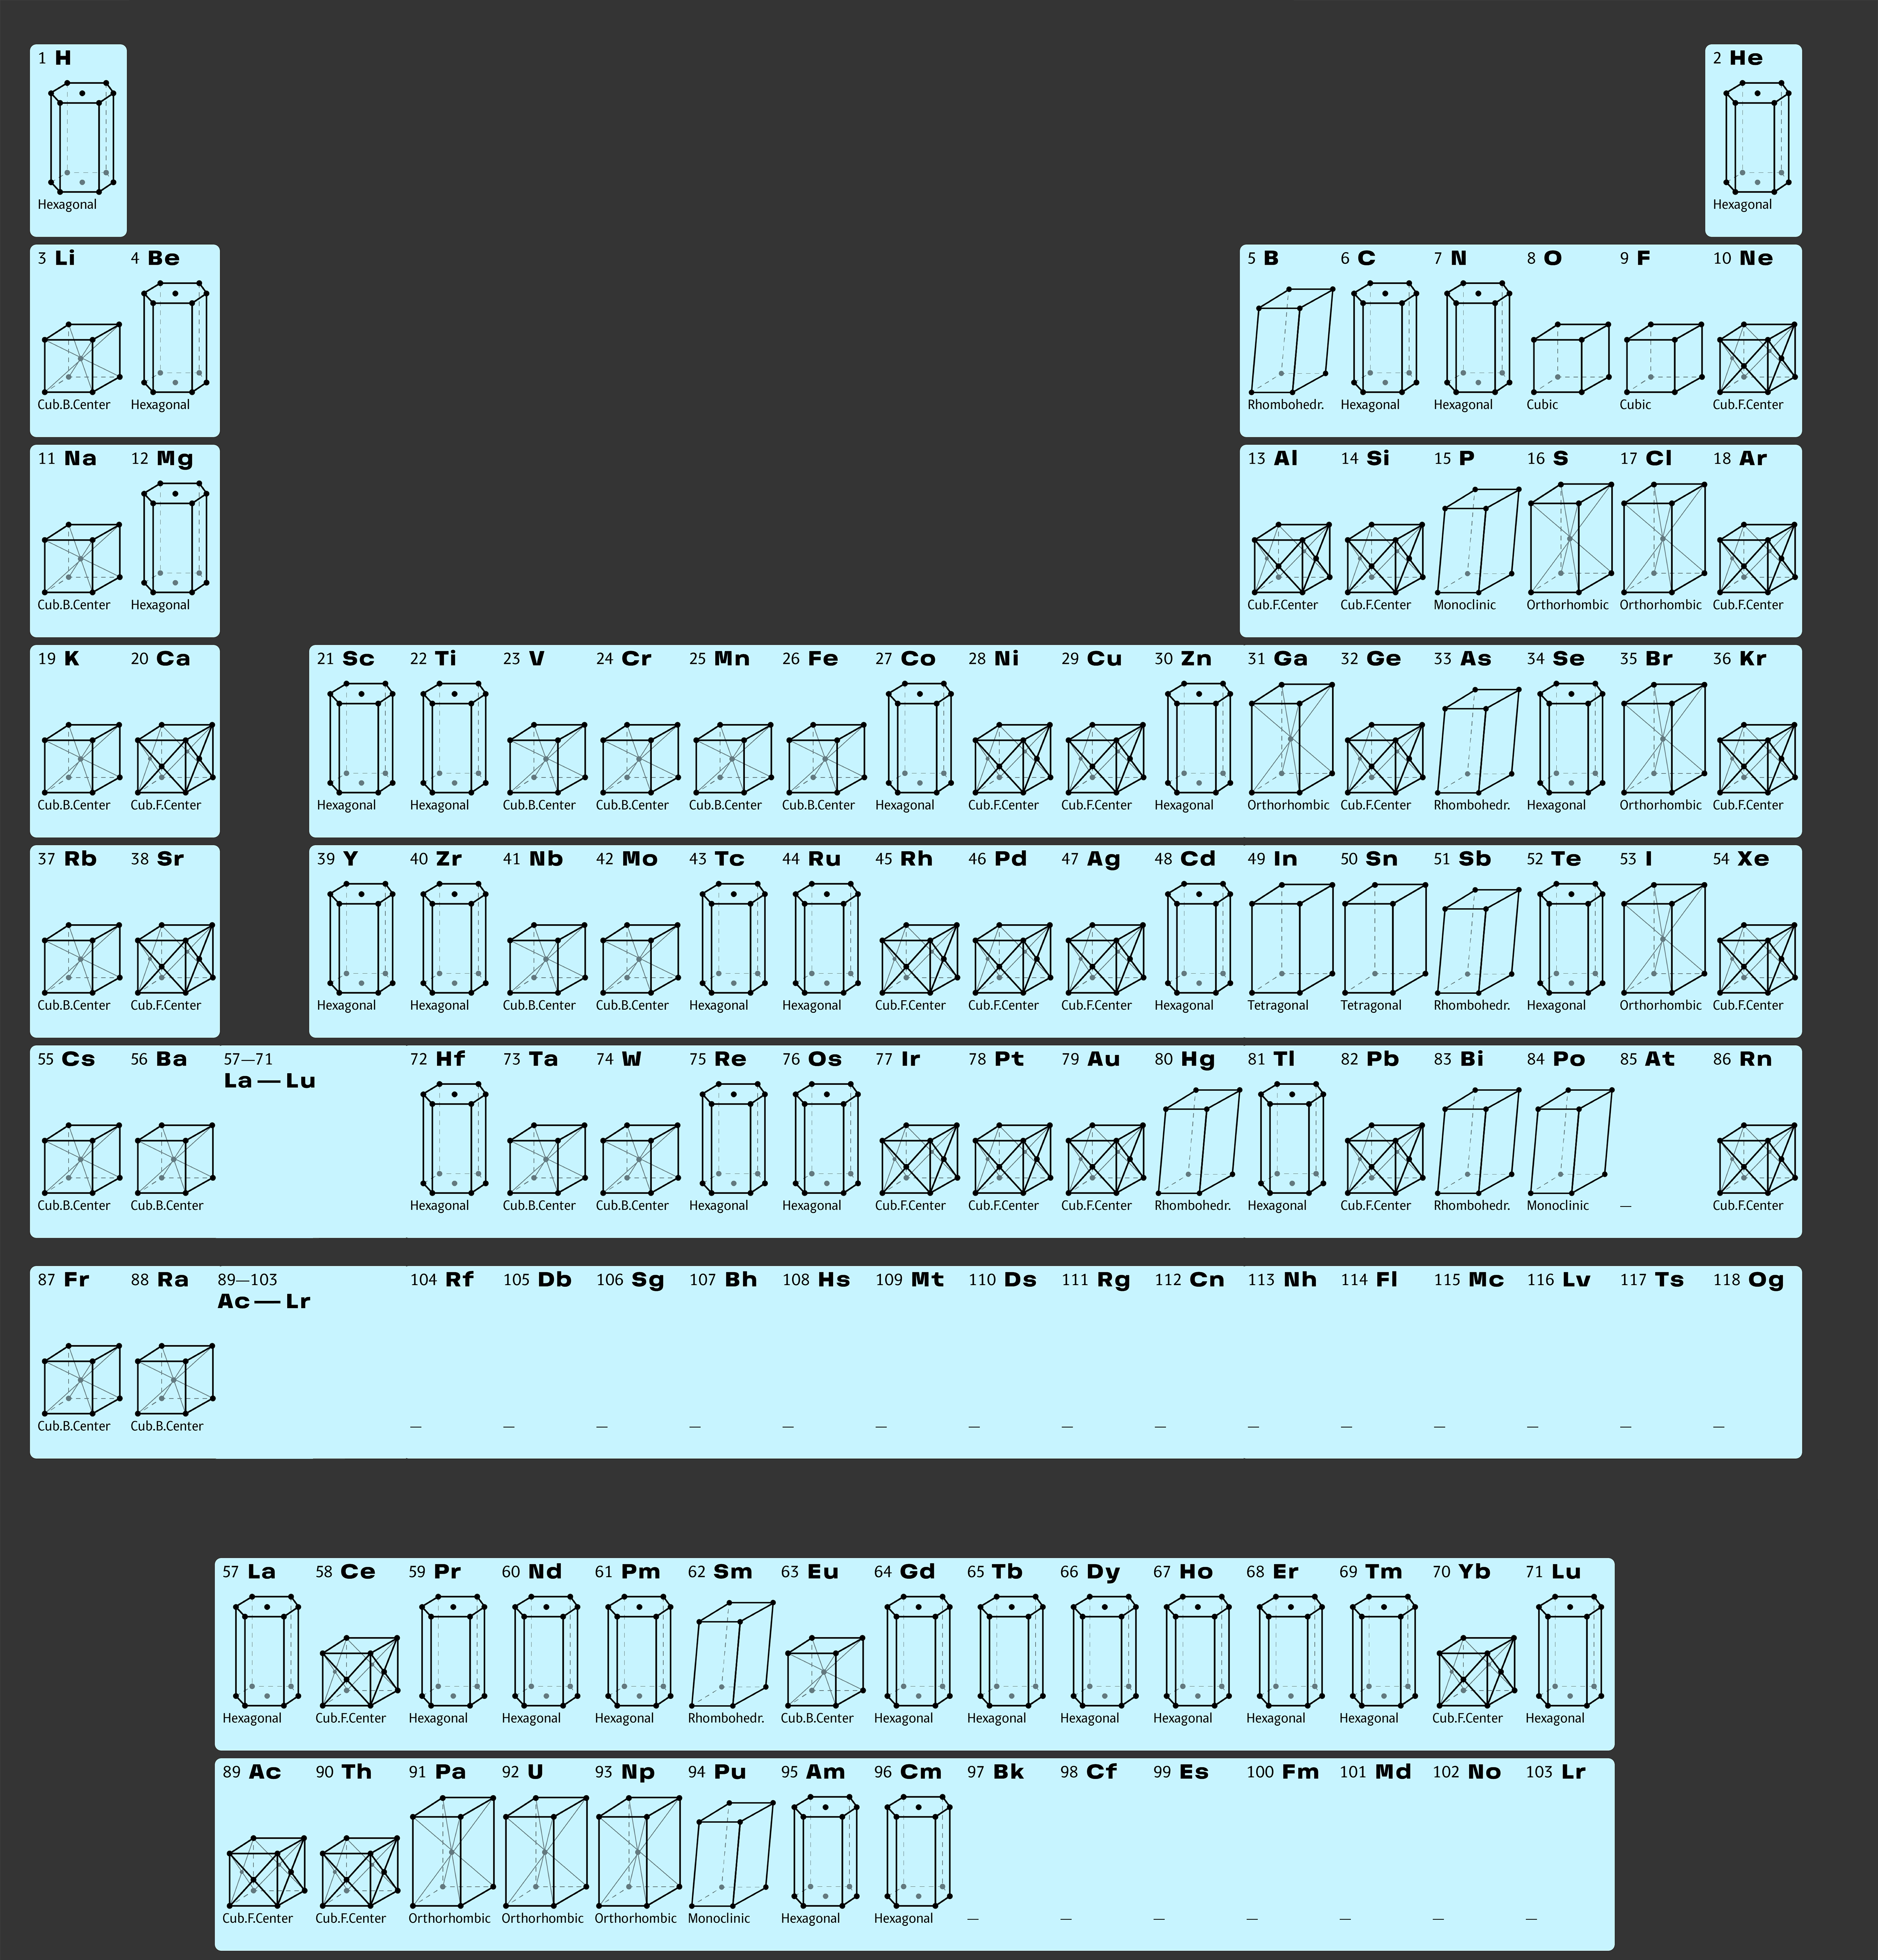
Crystal lattice
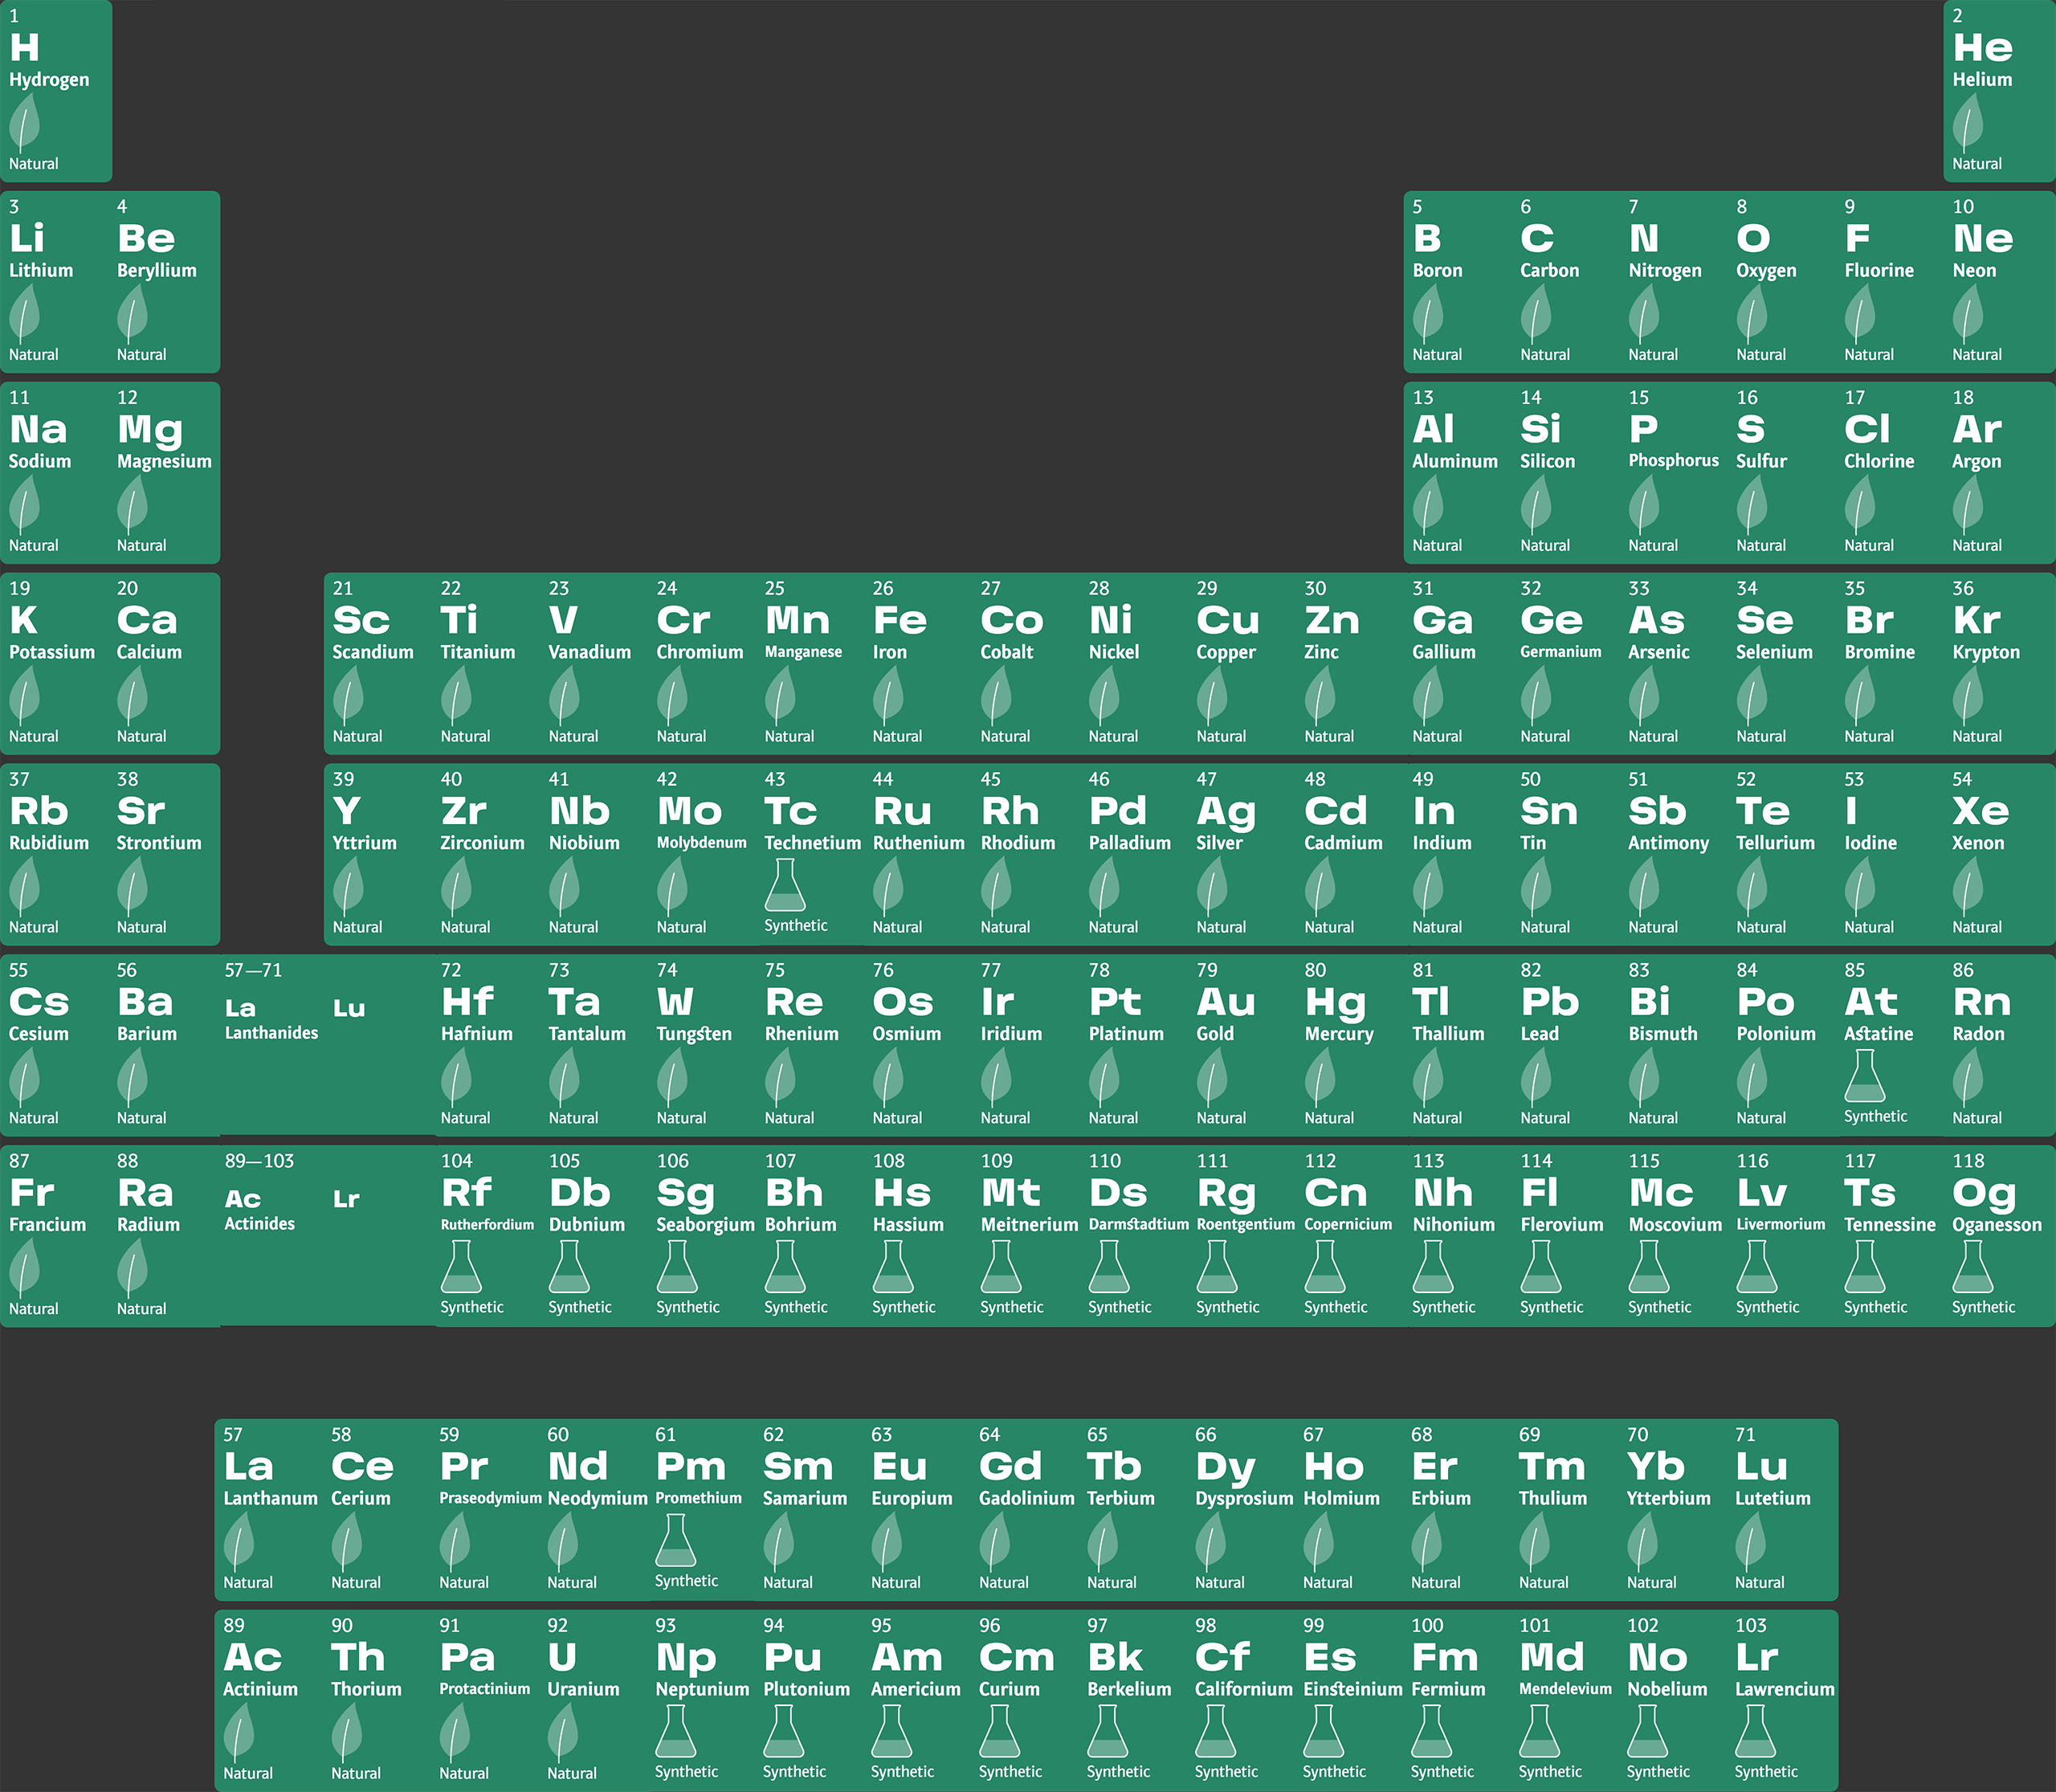
Occurrence in nature
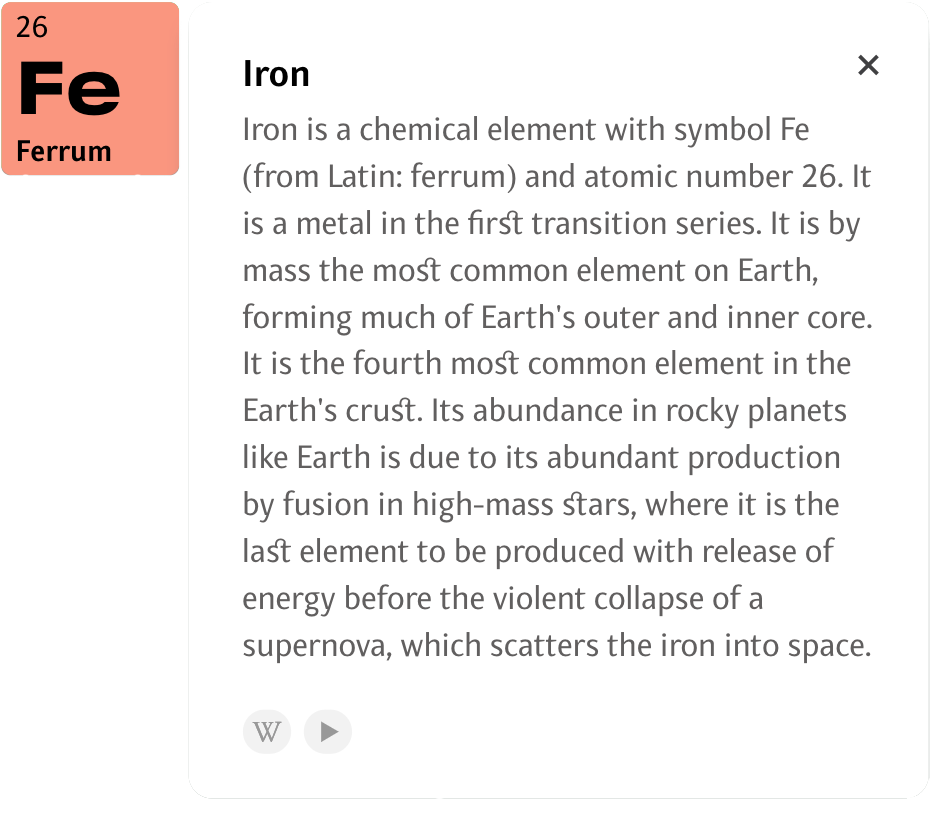
Knowledge base
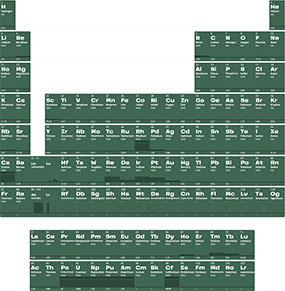
The table contains an overview of each element as well as a set of videos and a link to the Wikipedia page.
 YouTube
 Wikipedia

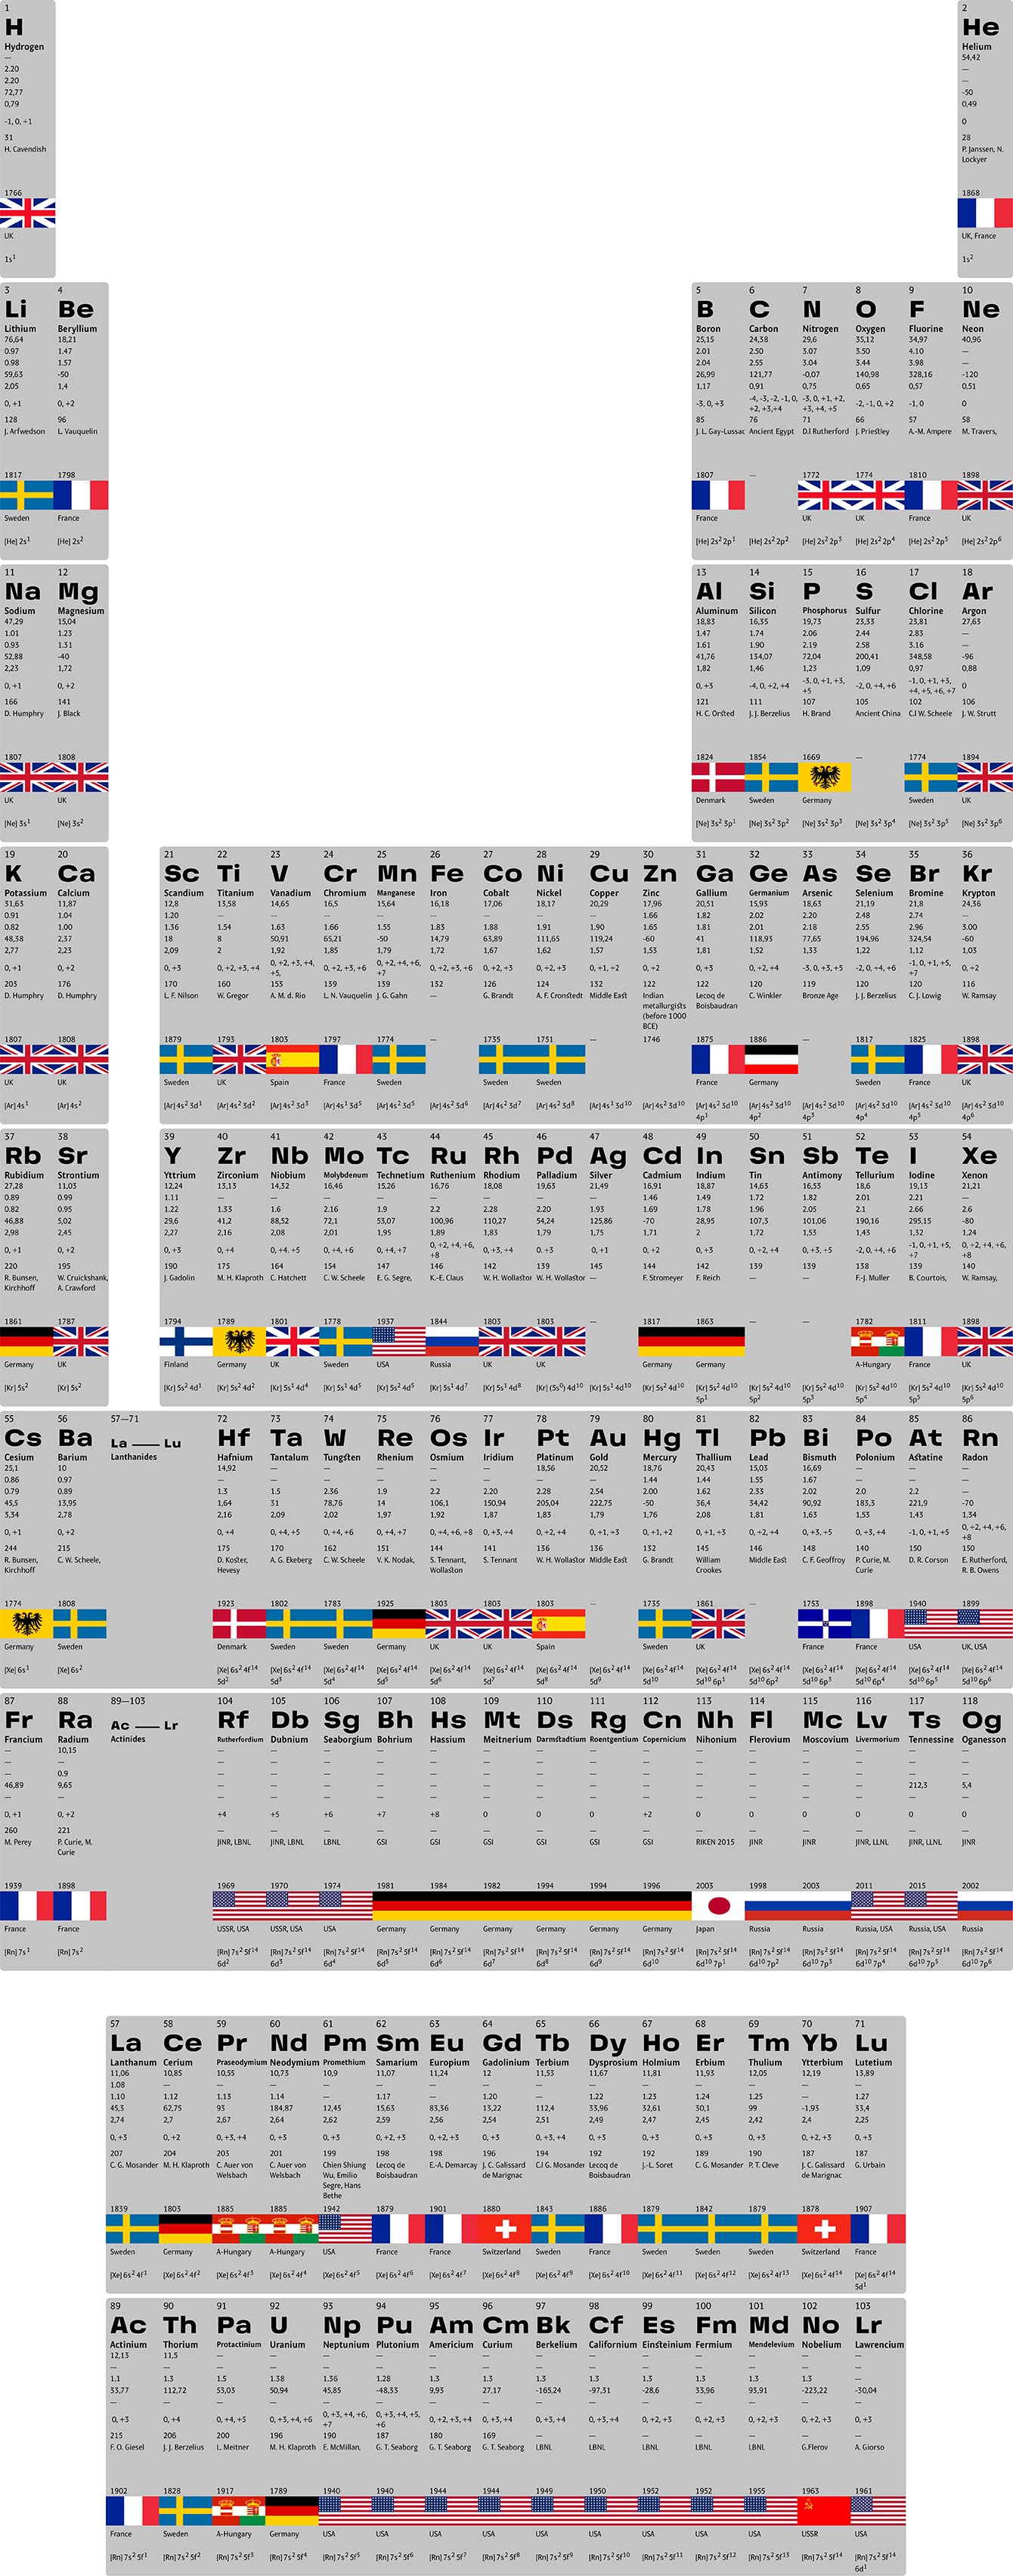
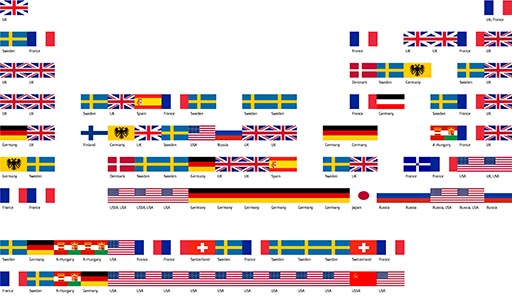
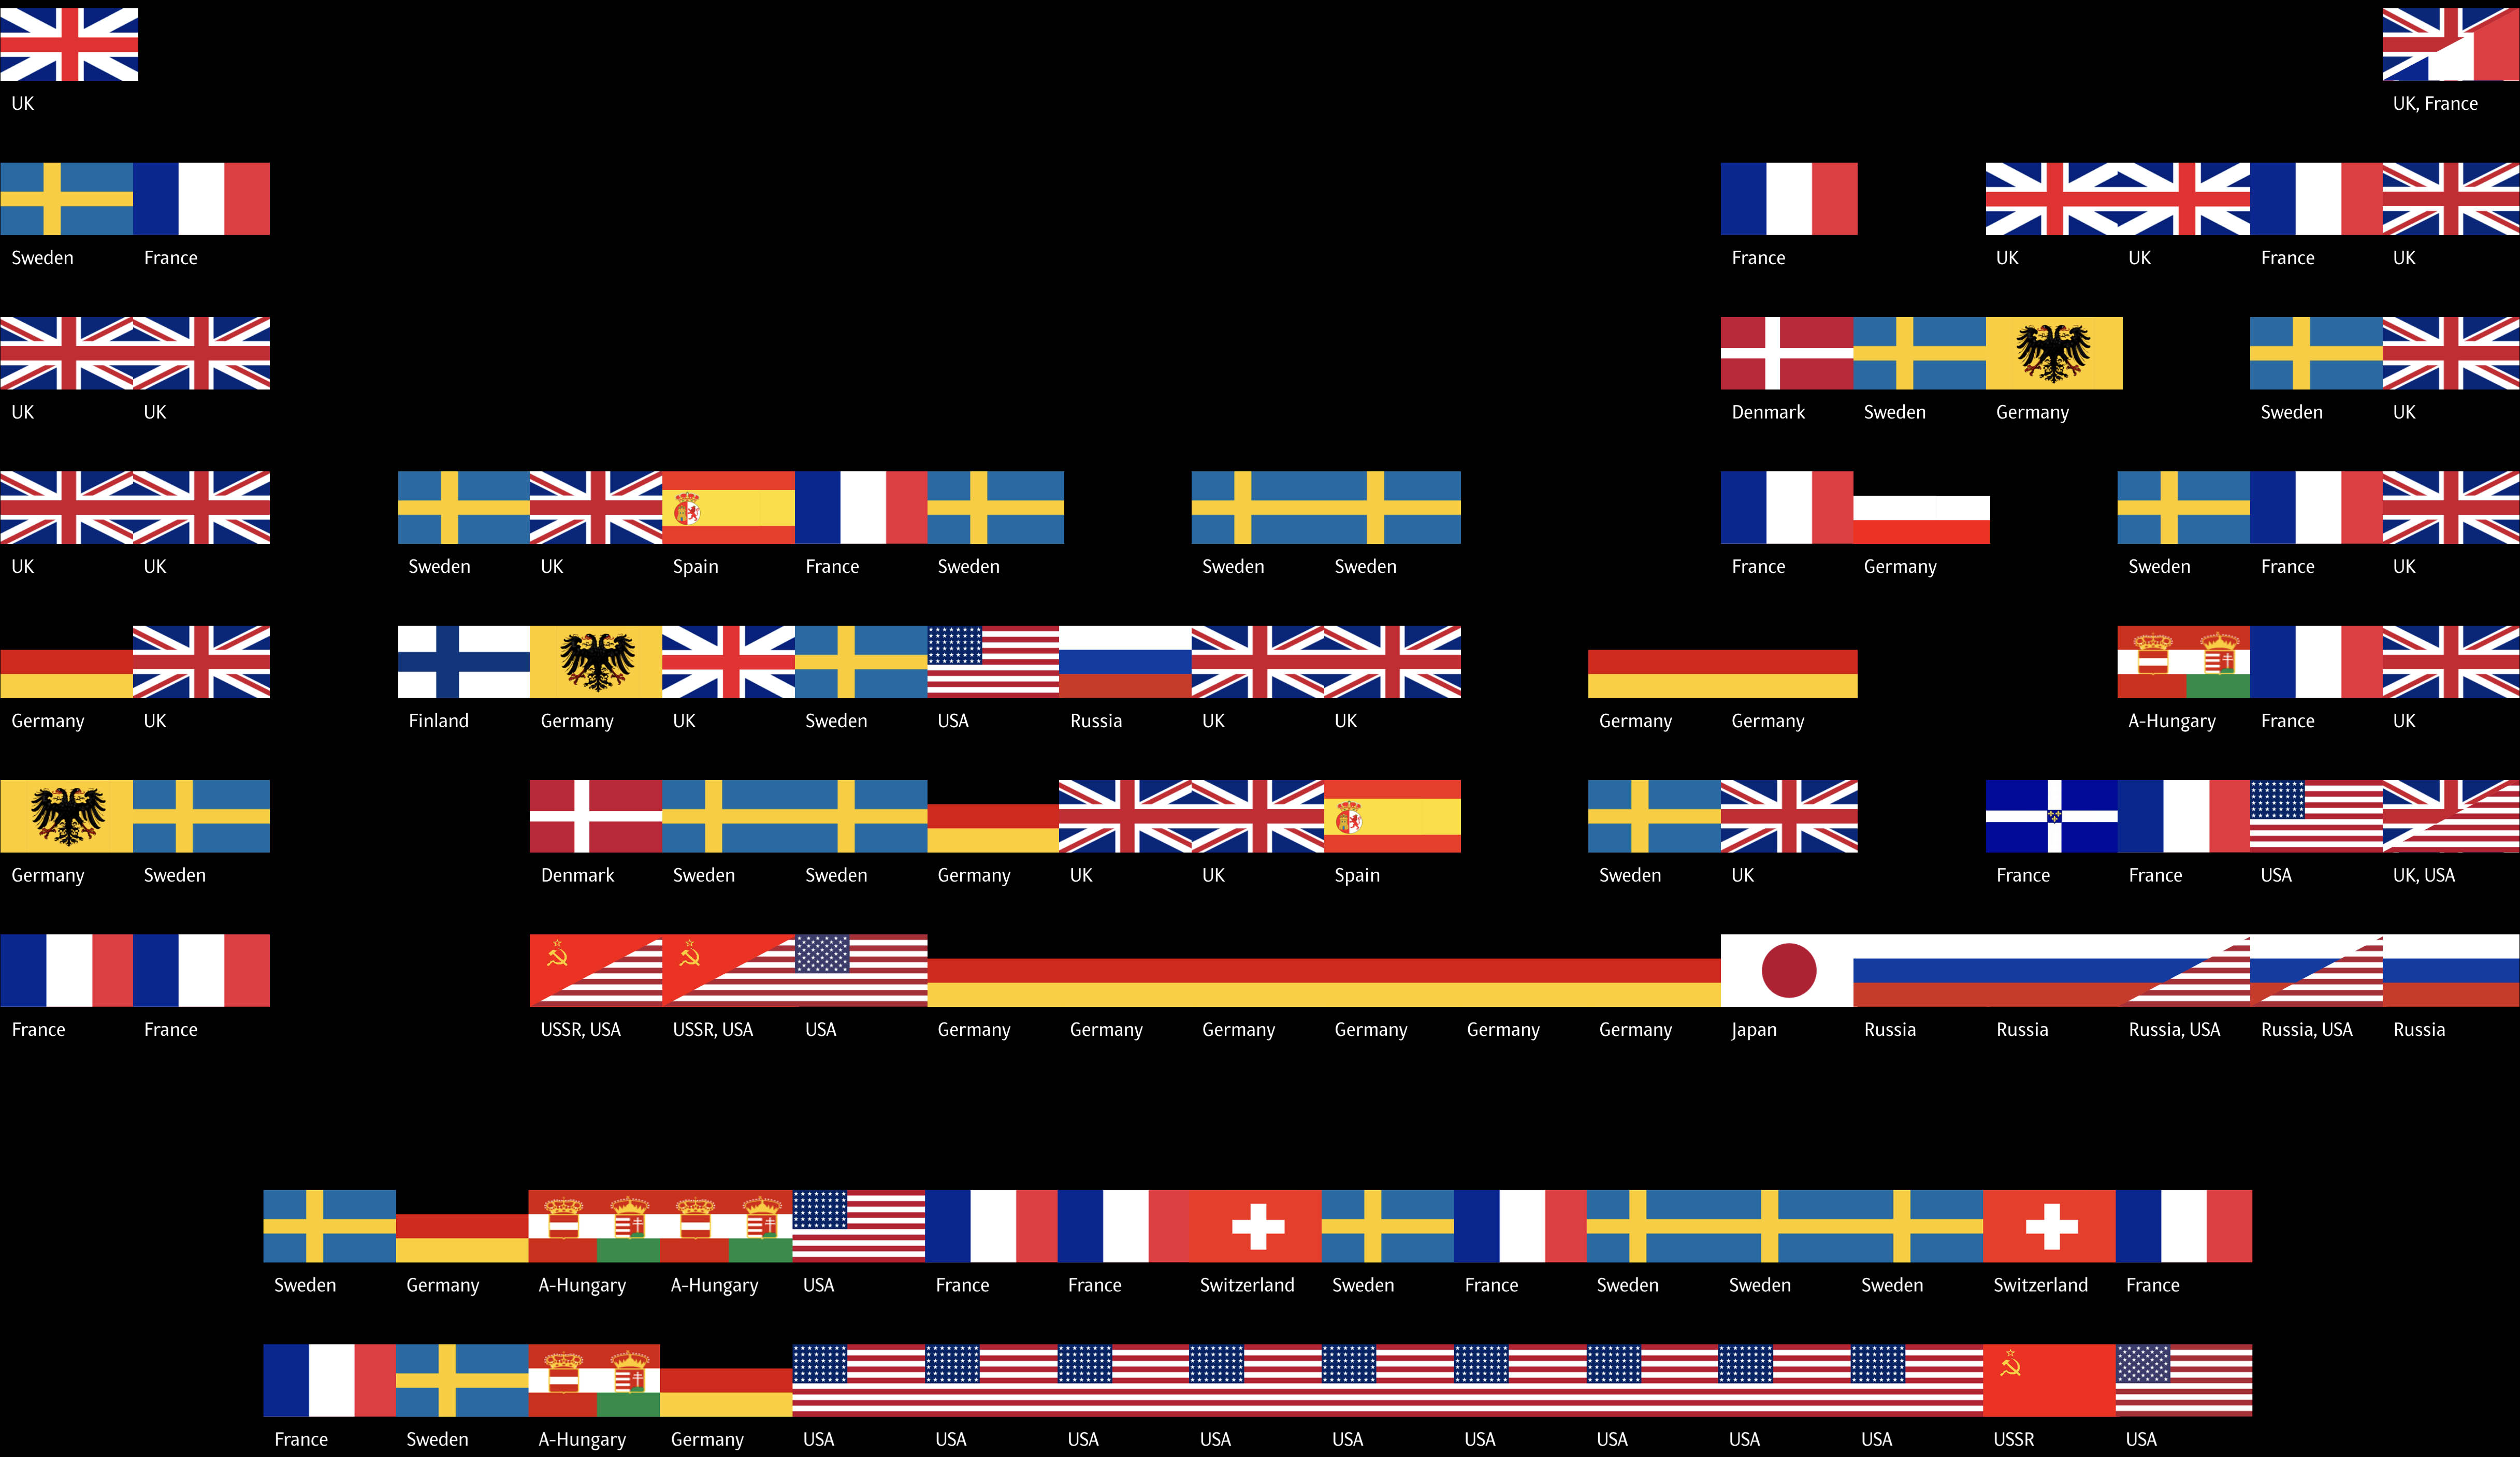
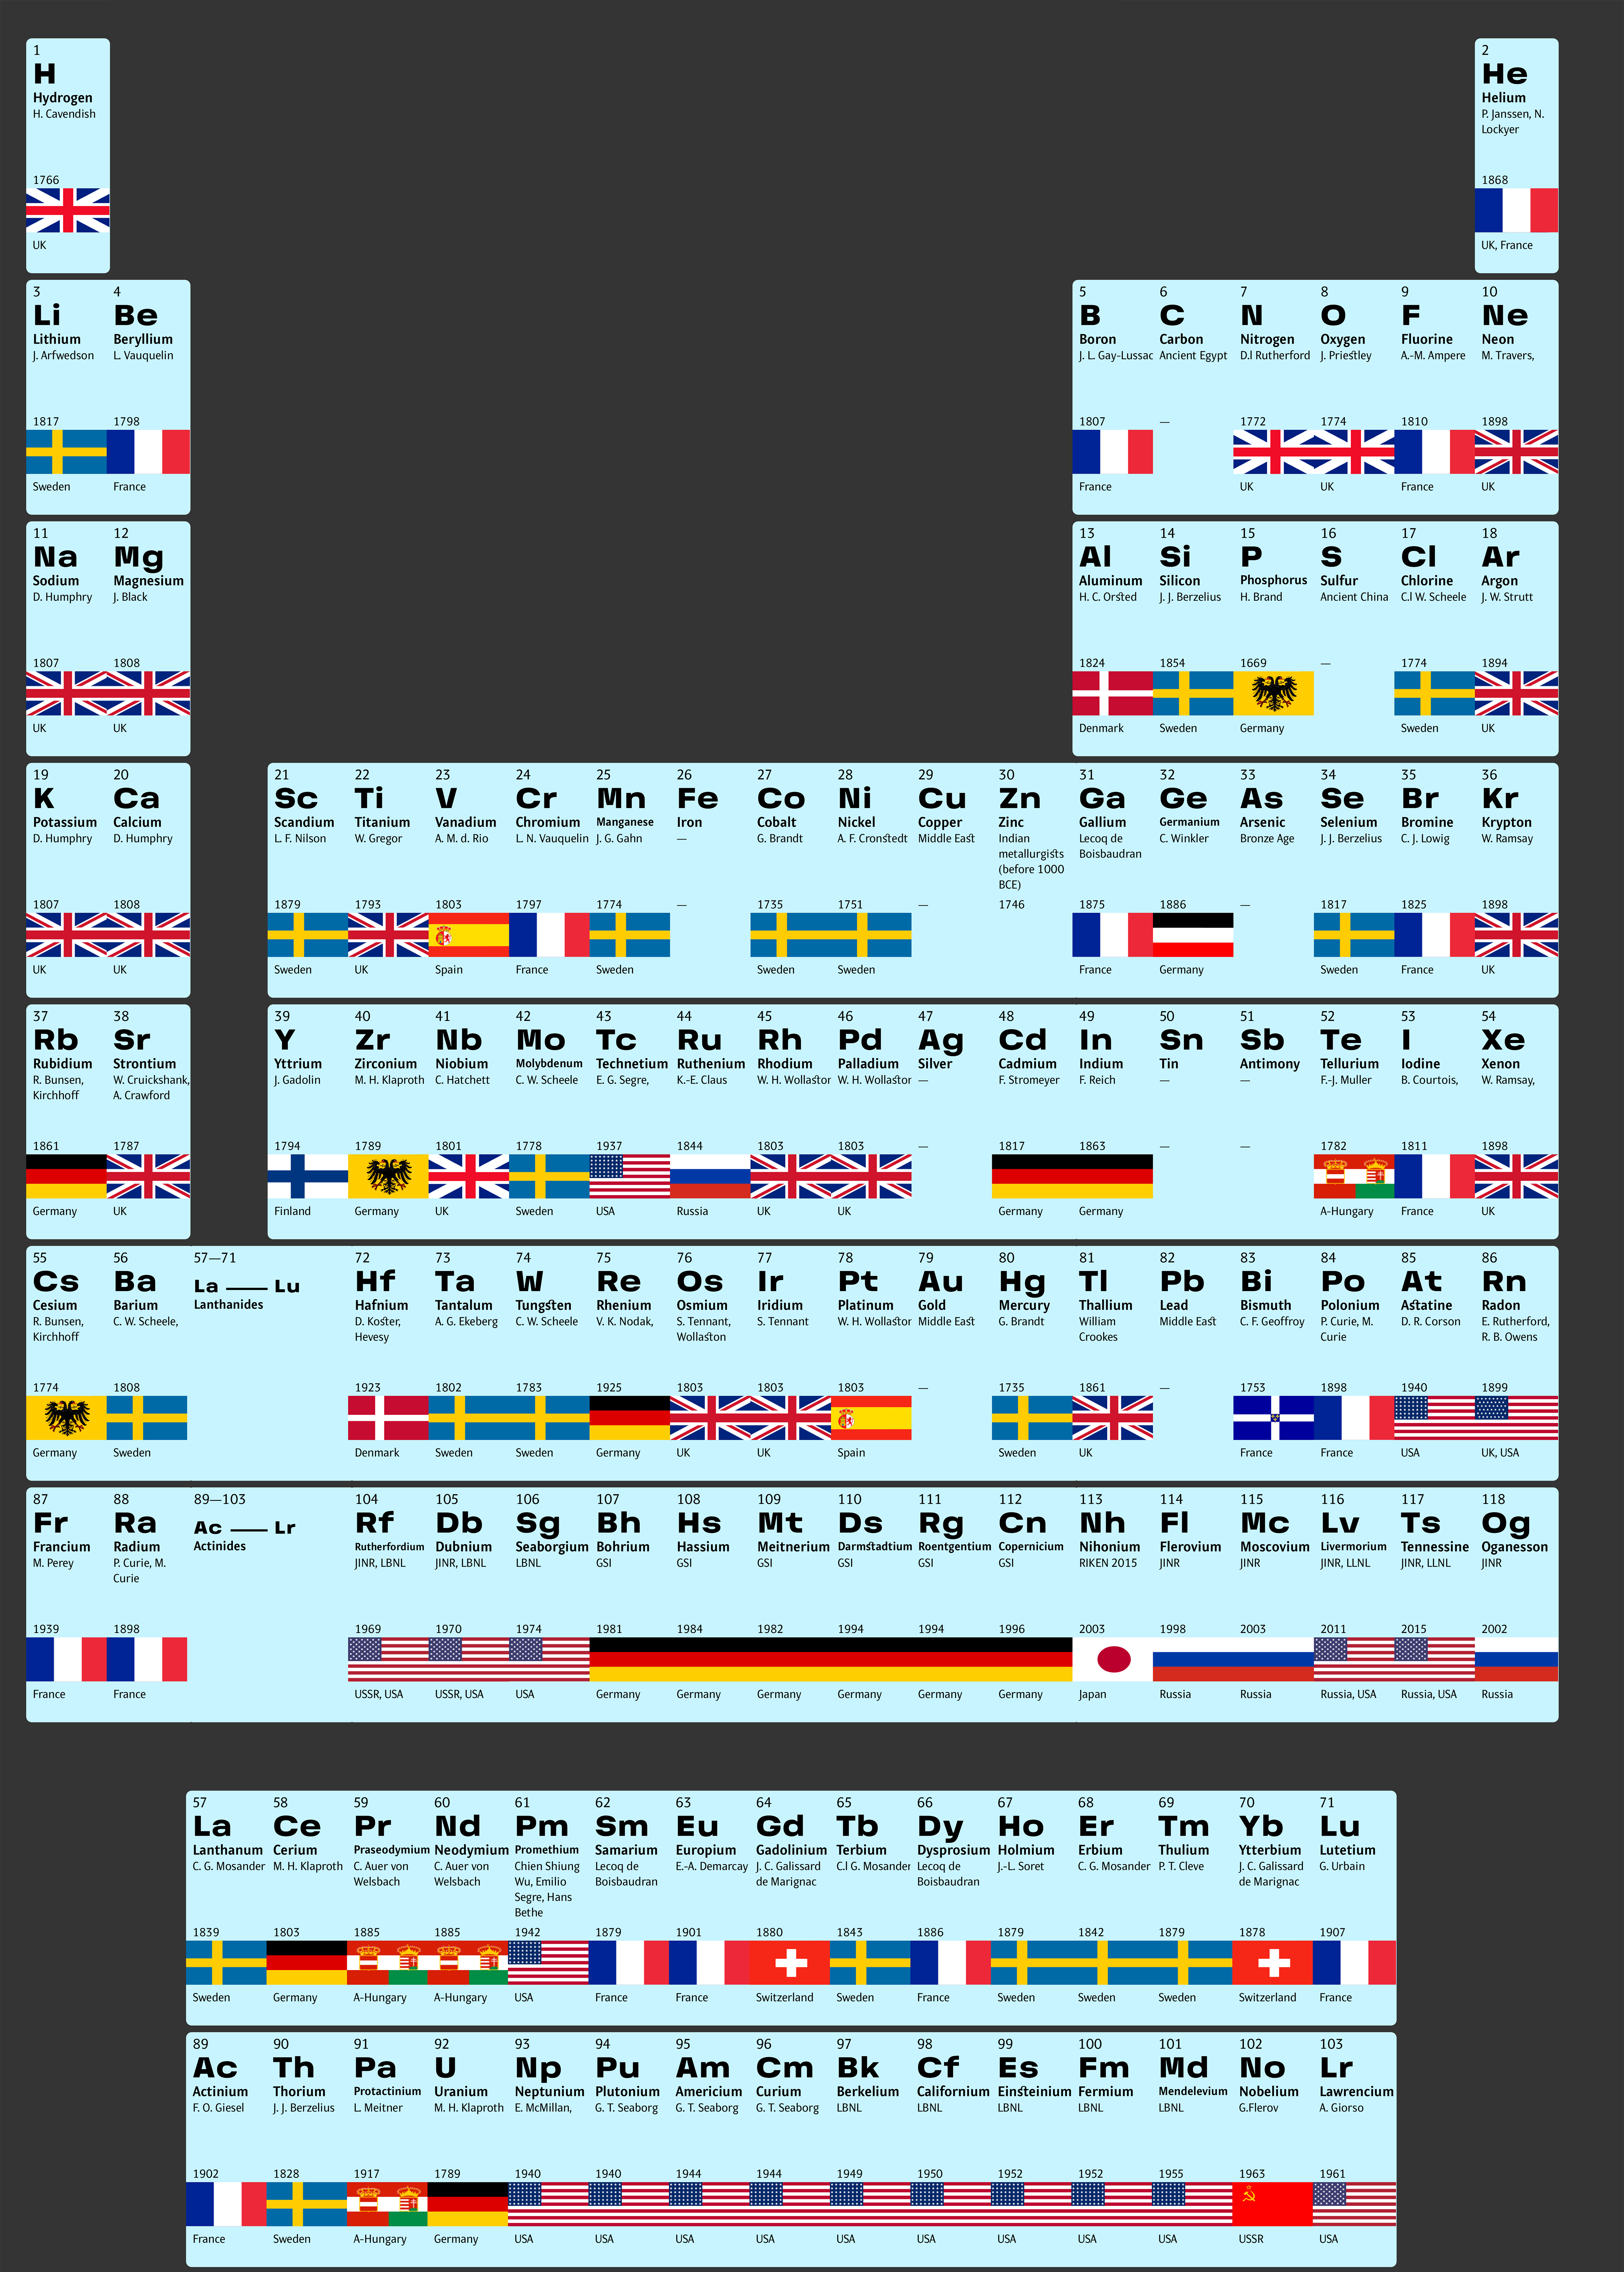
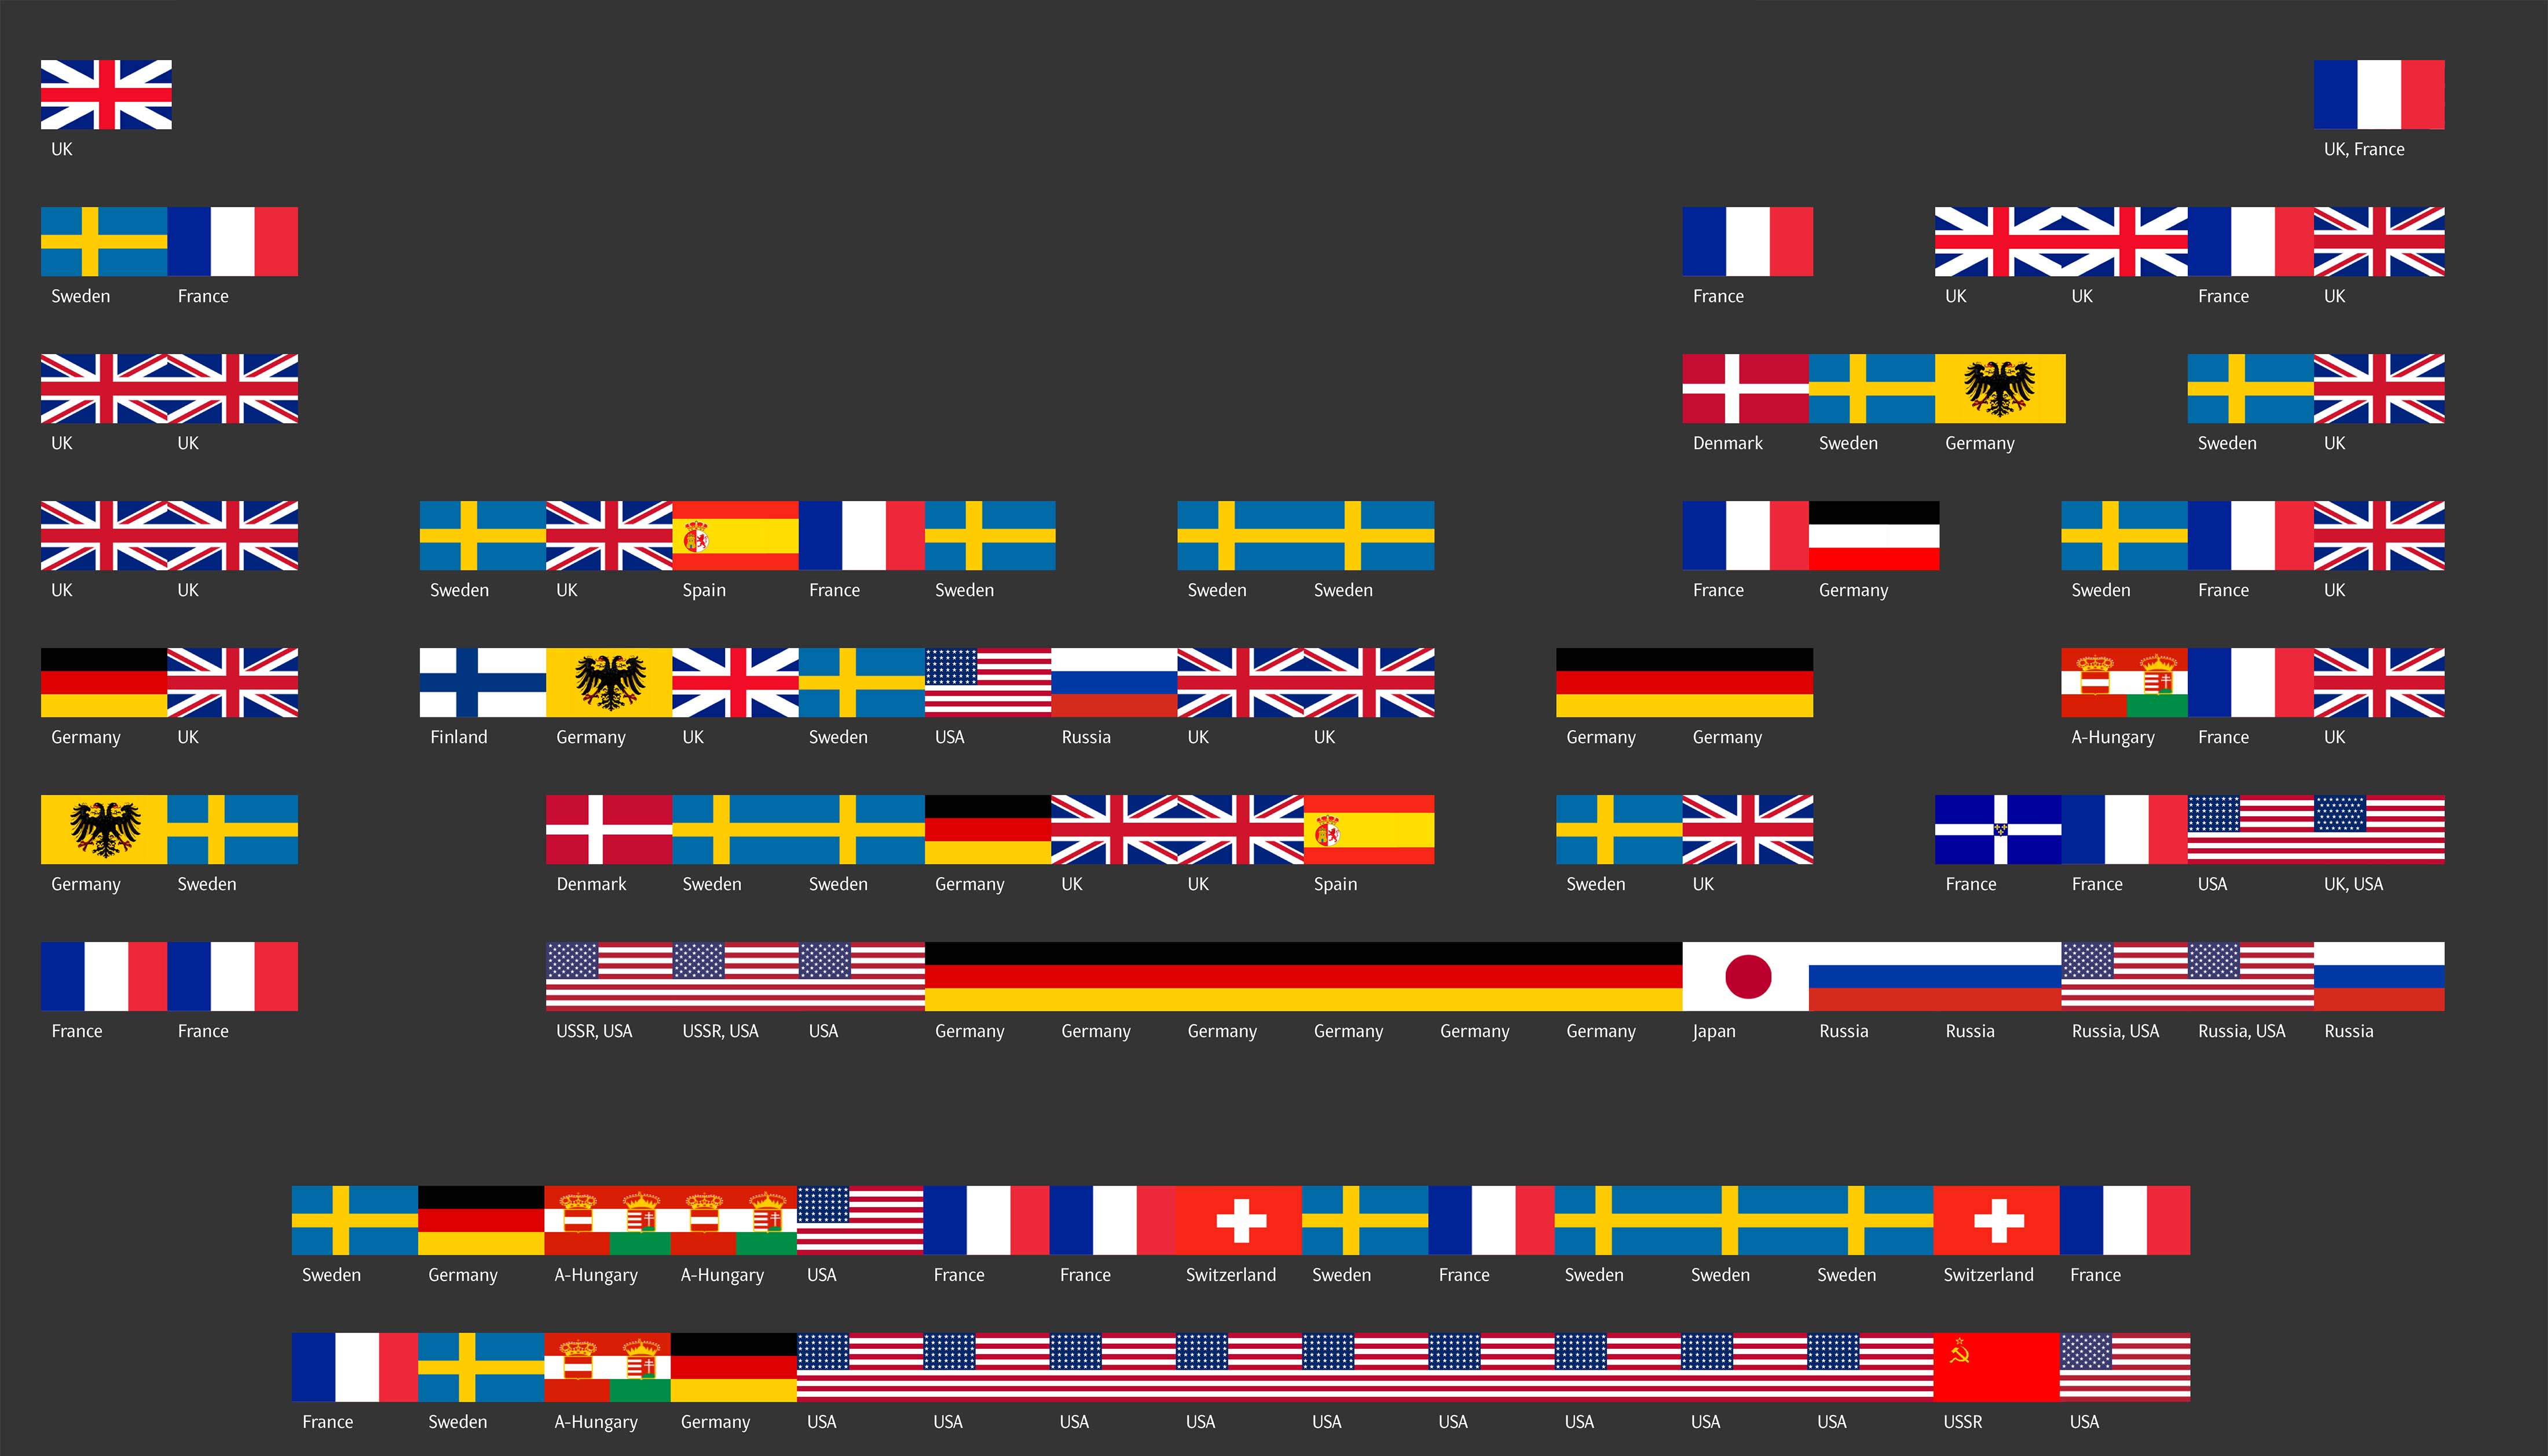
Discovery
We compiled various facts from the history of each element, including who discovered what — and when. We even show the flags of their home countries.


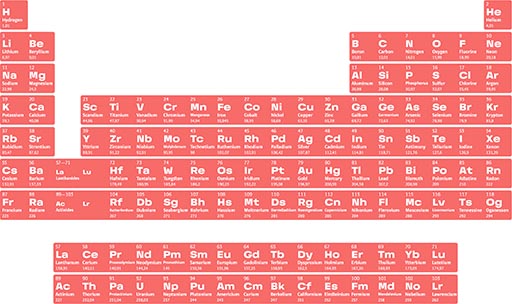
Appearance
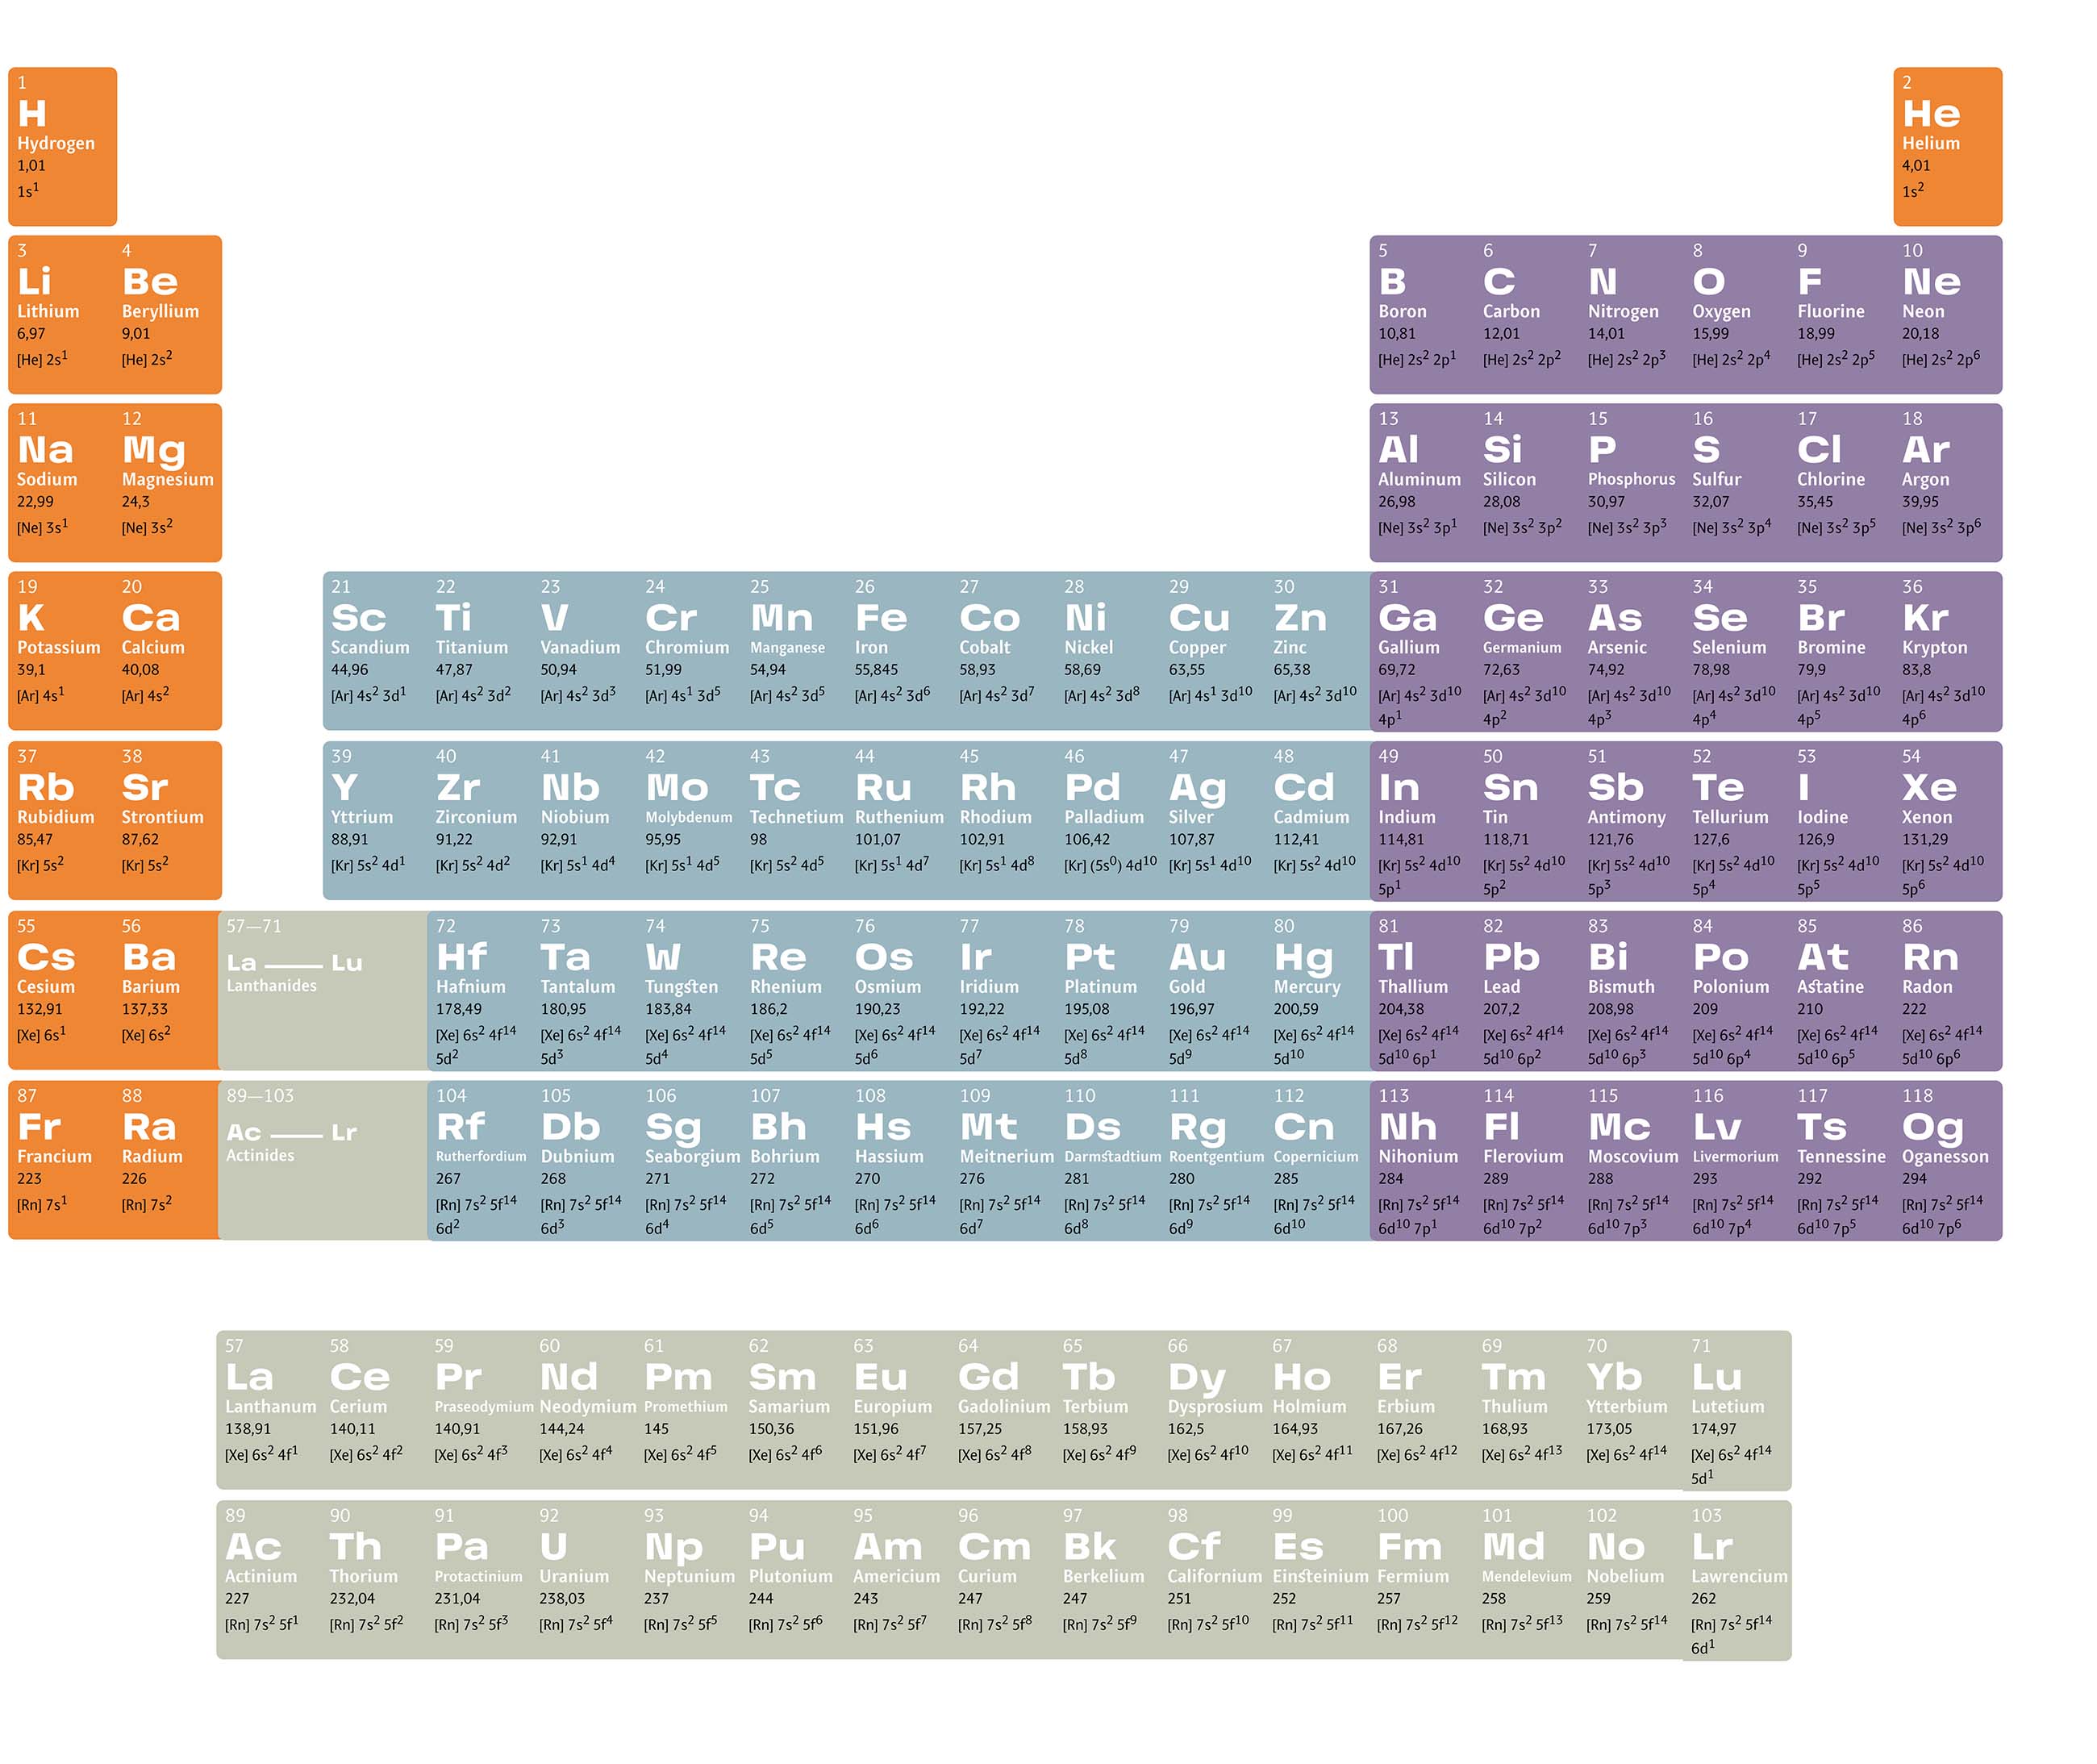
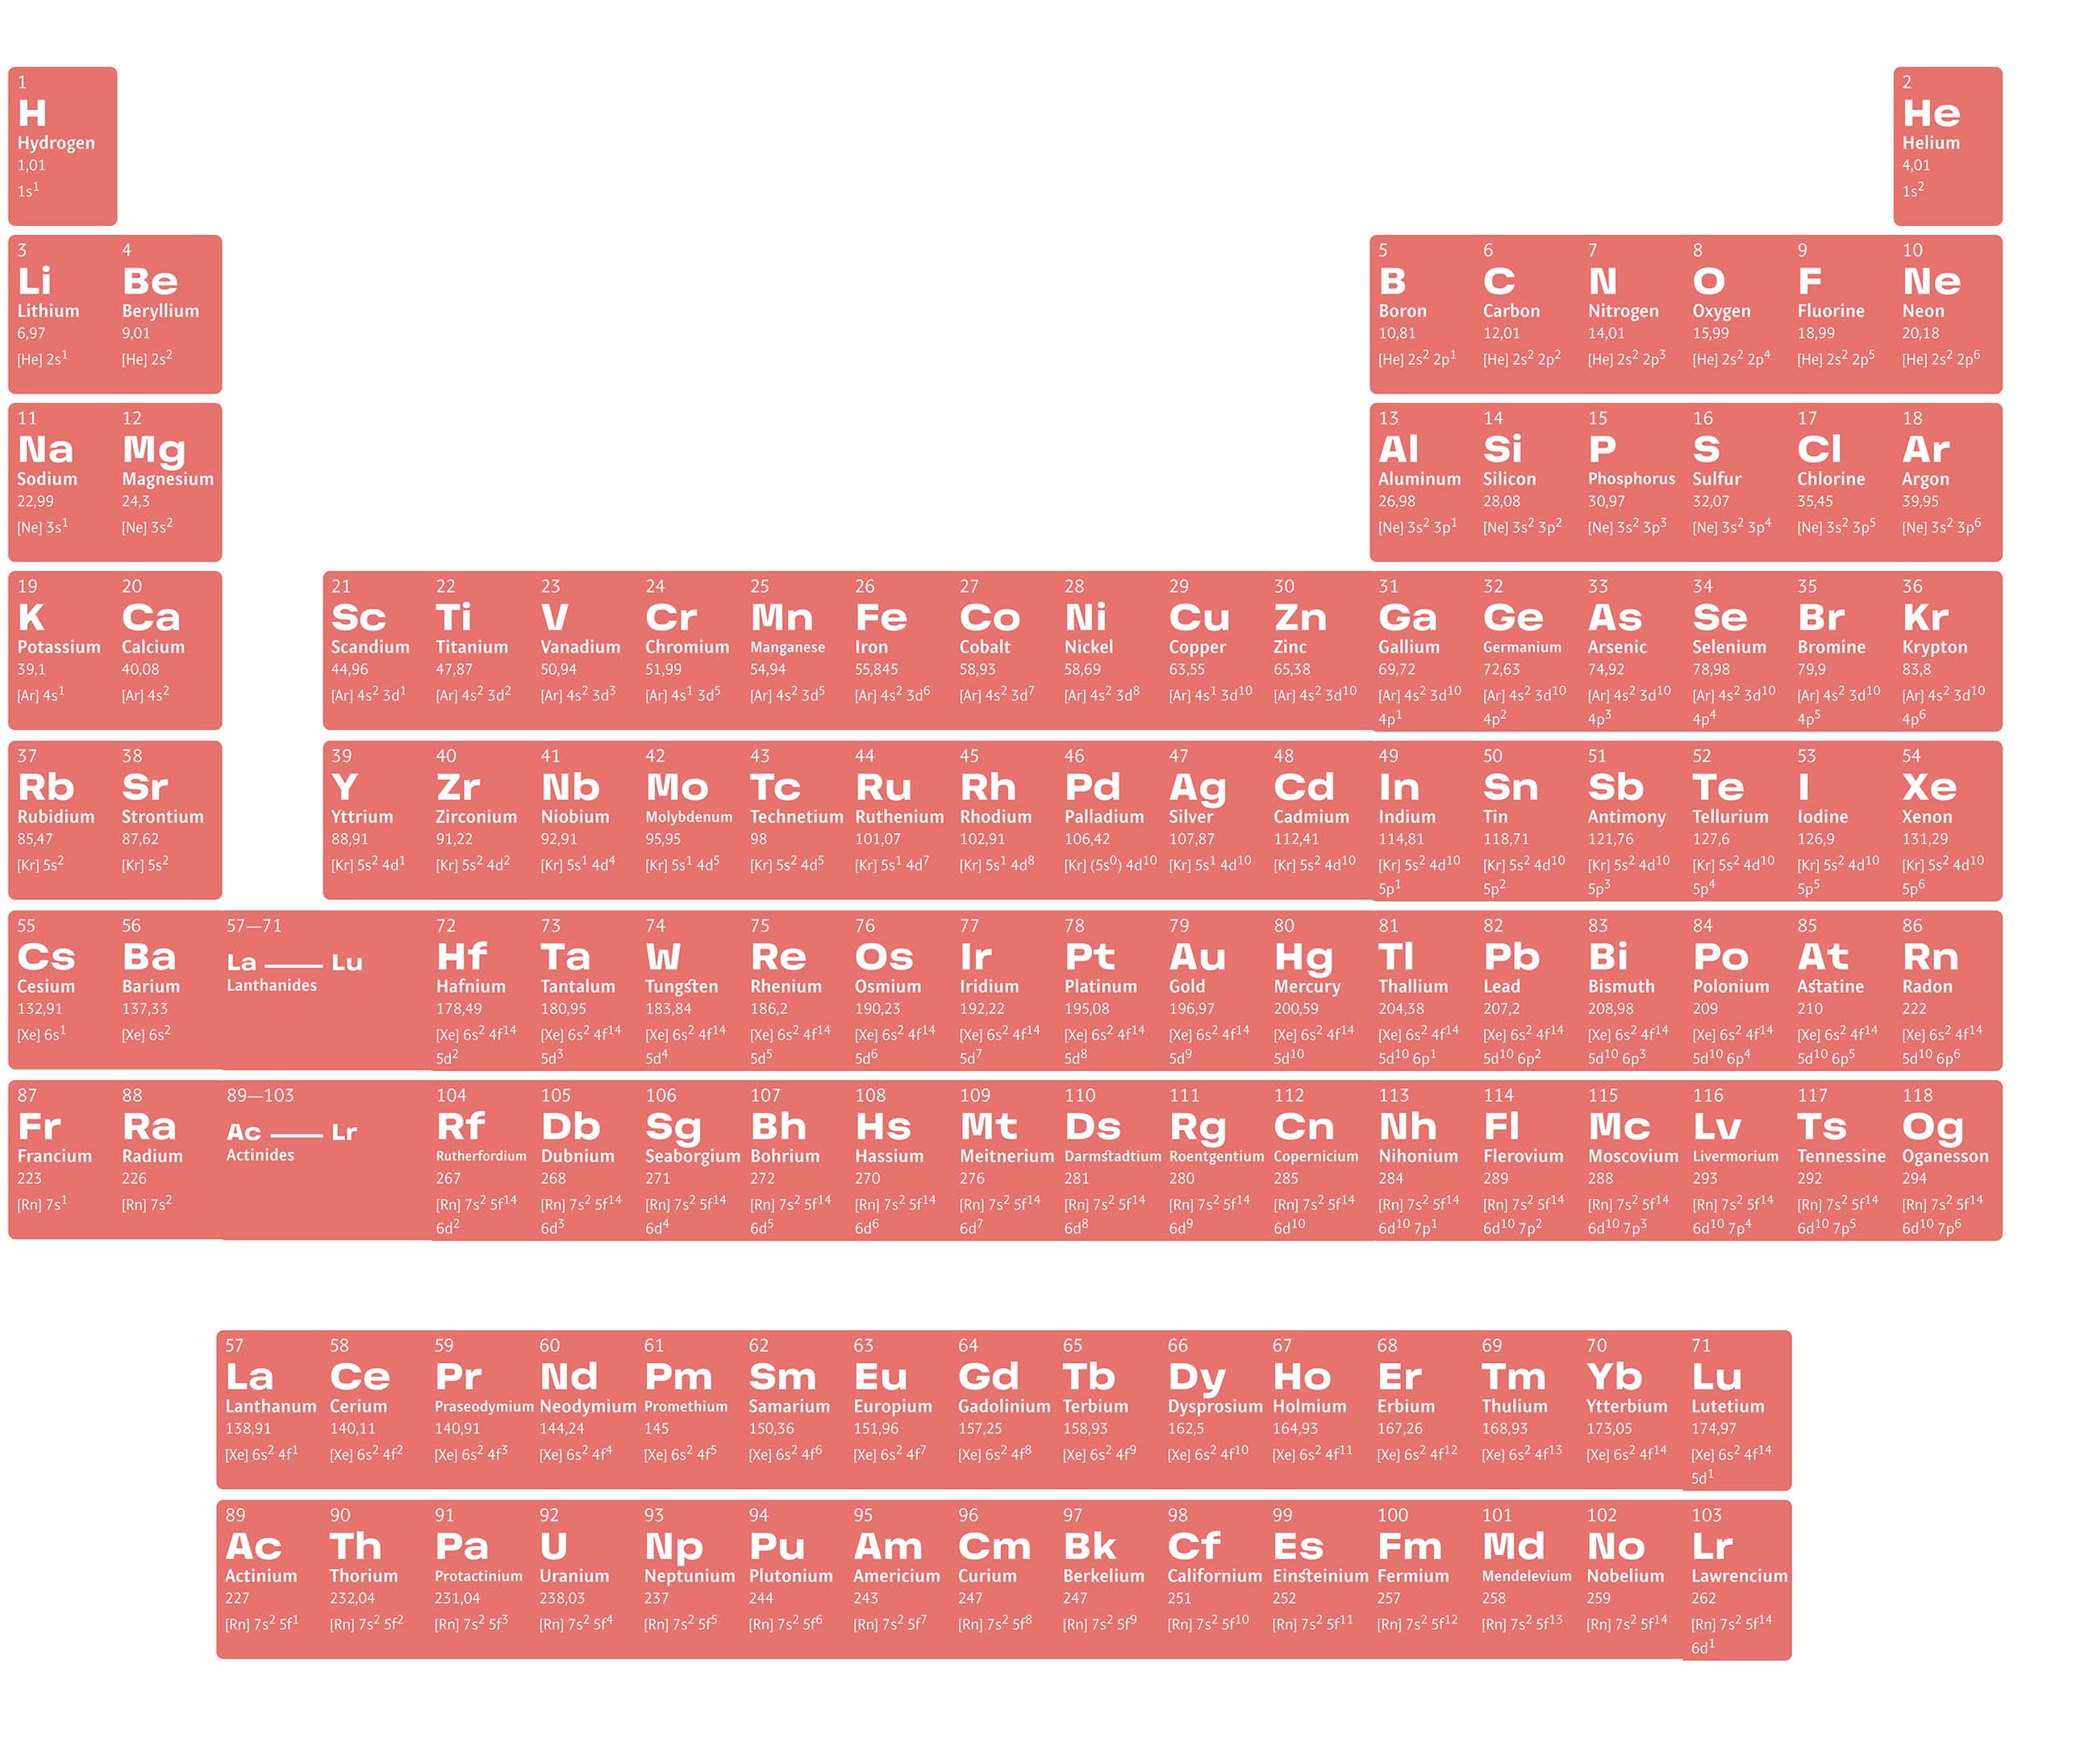
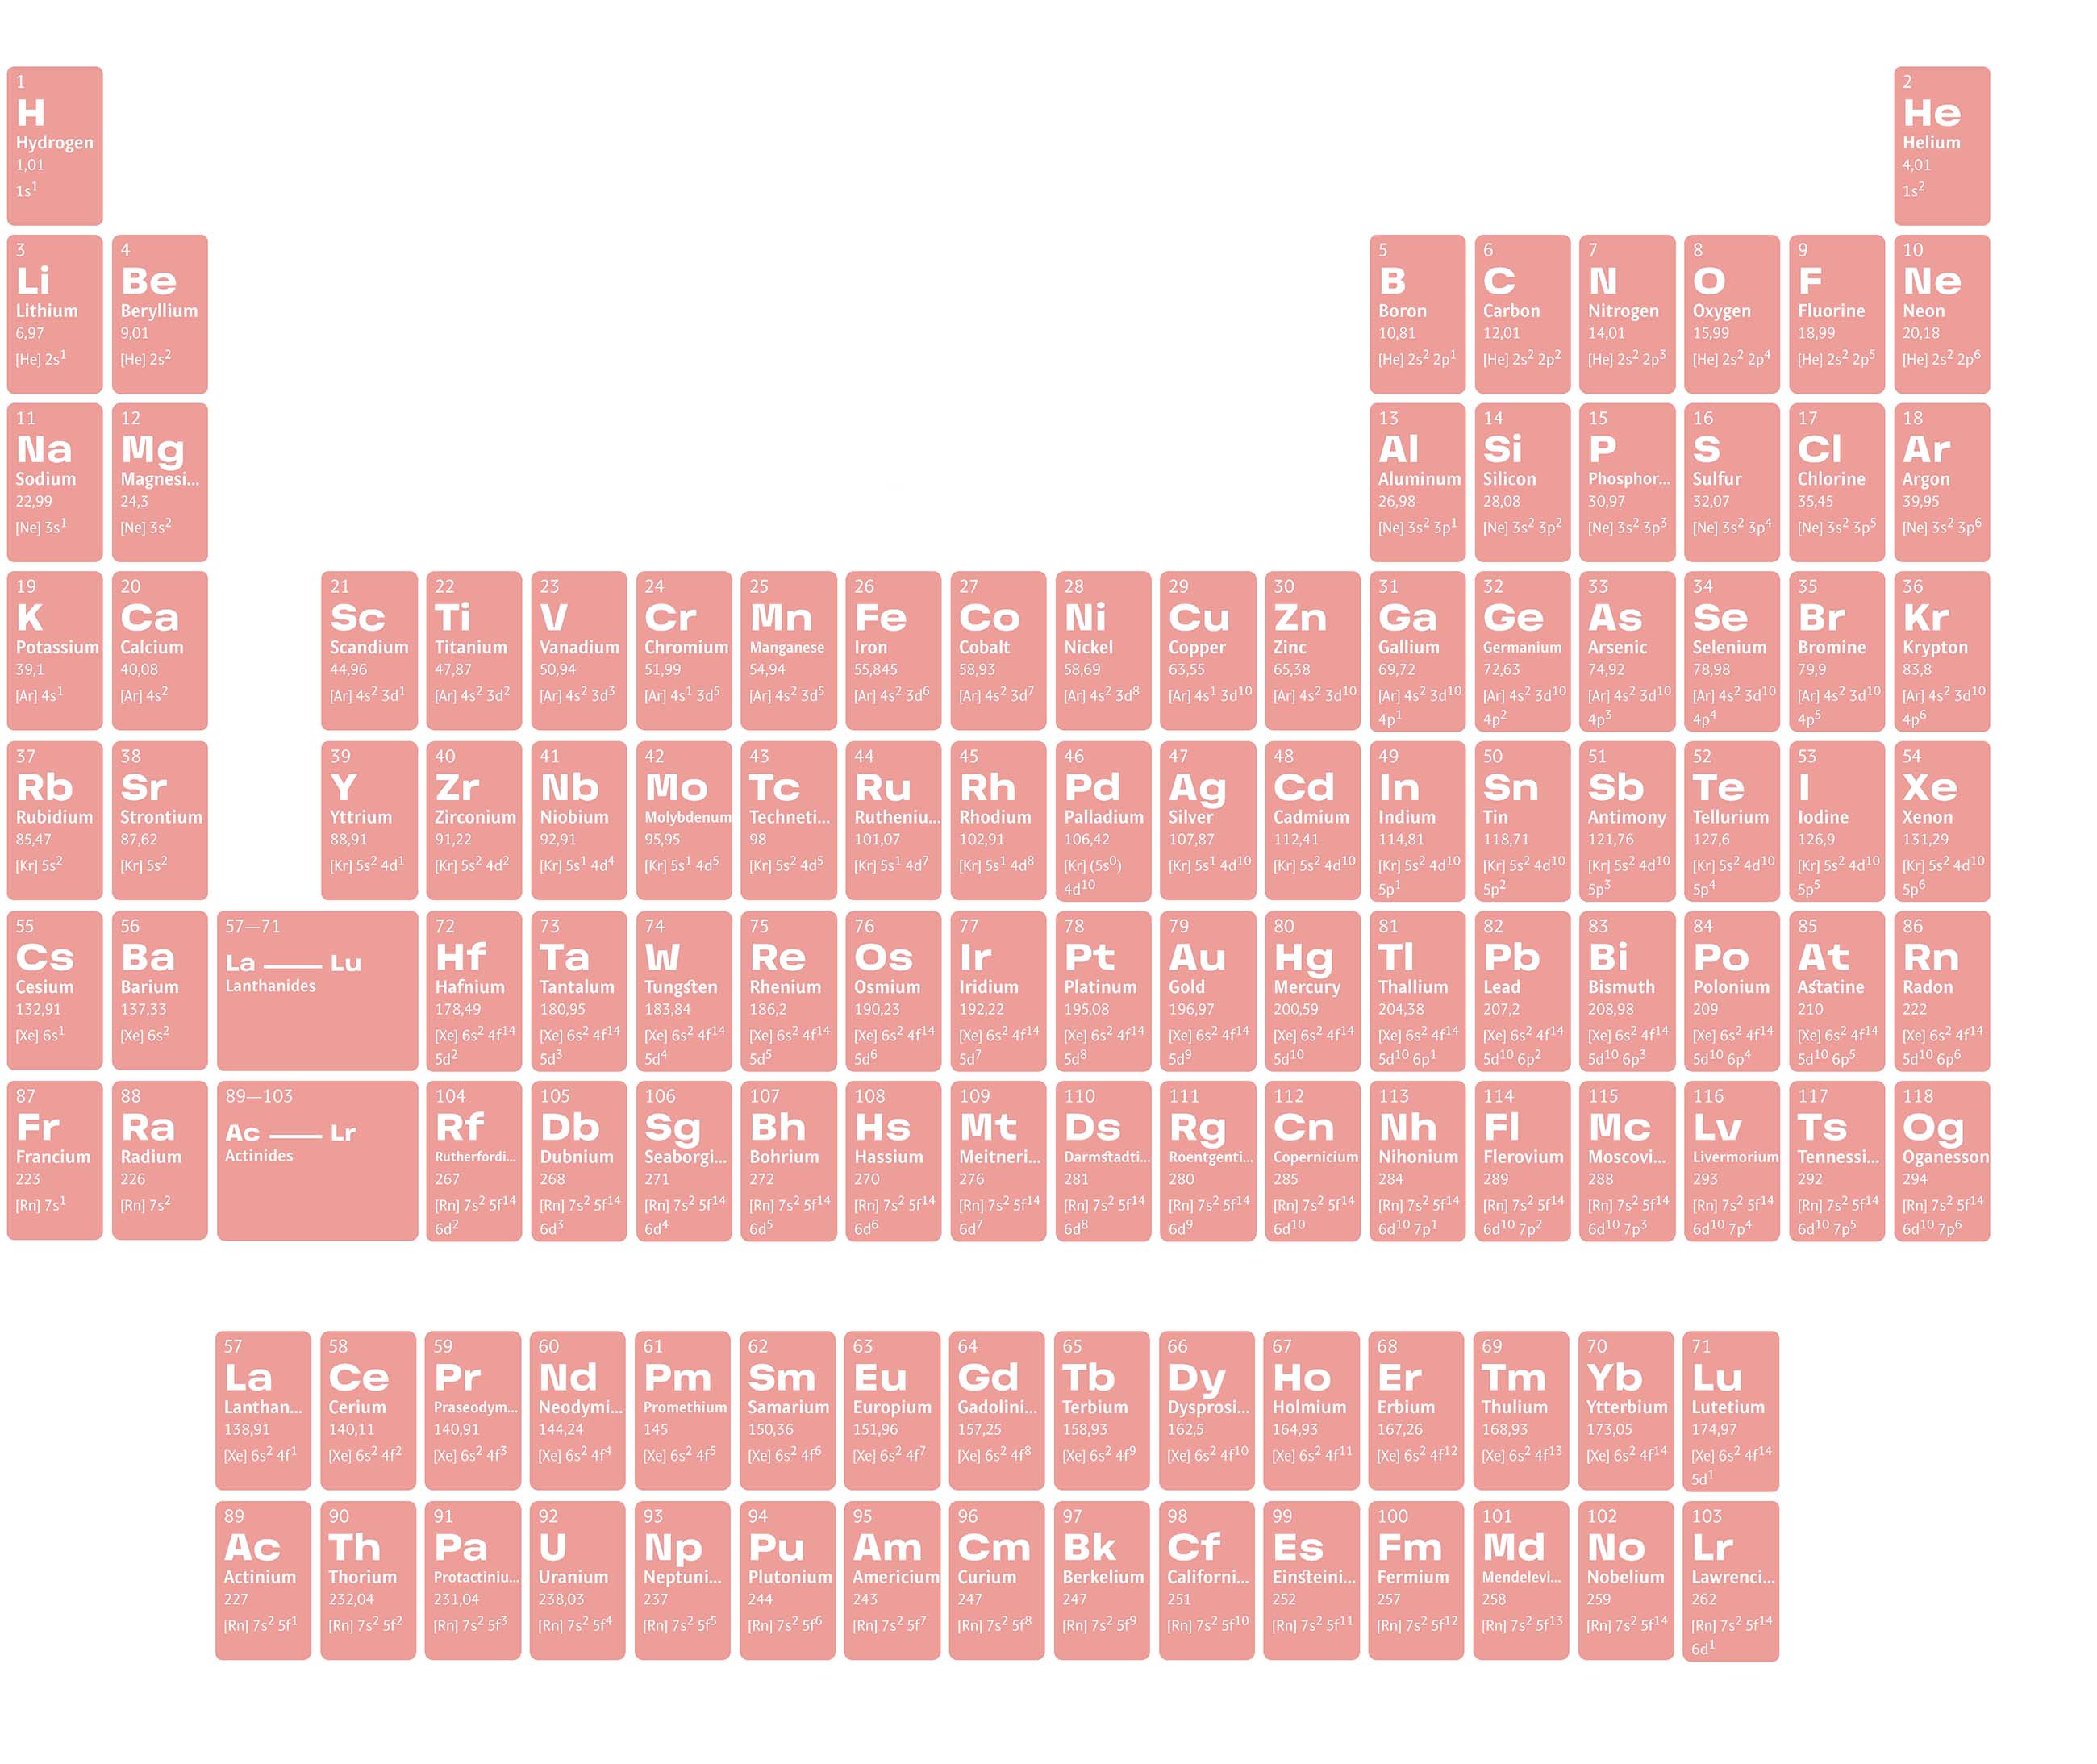
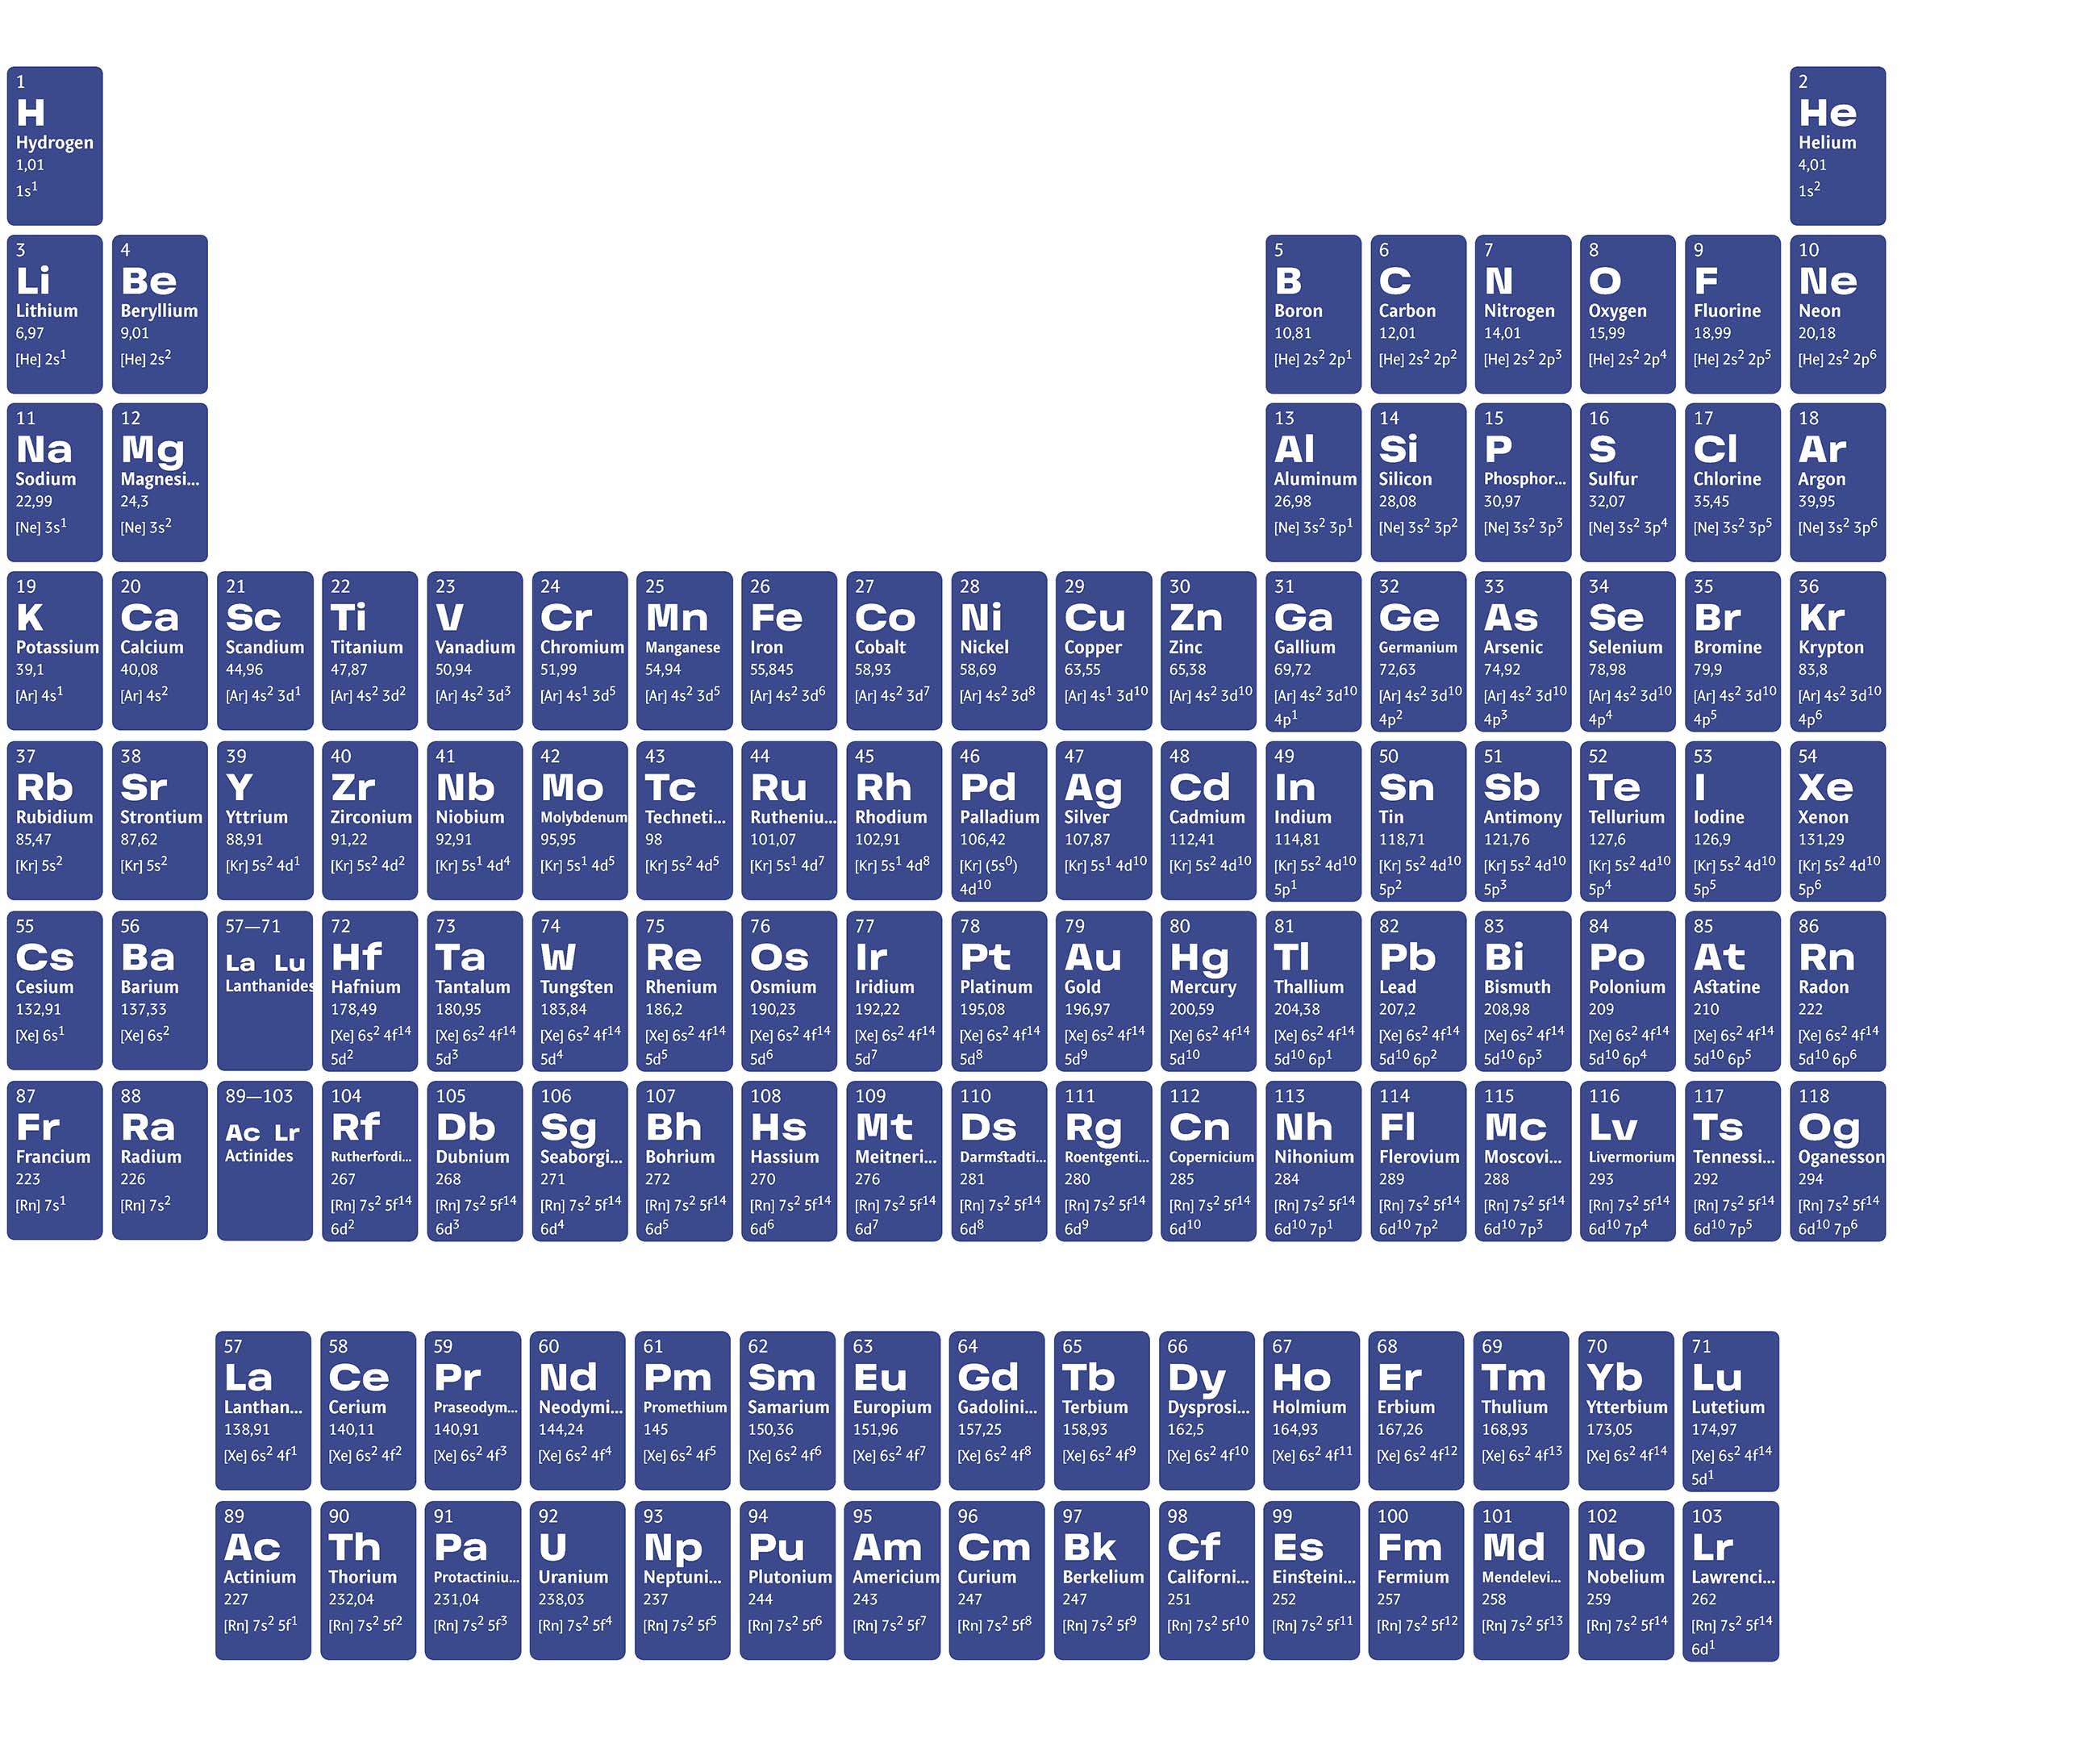
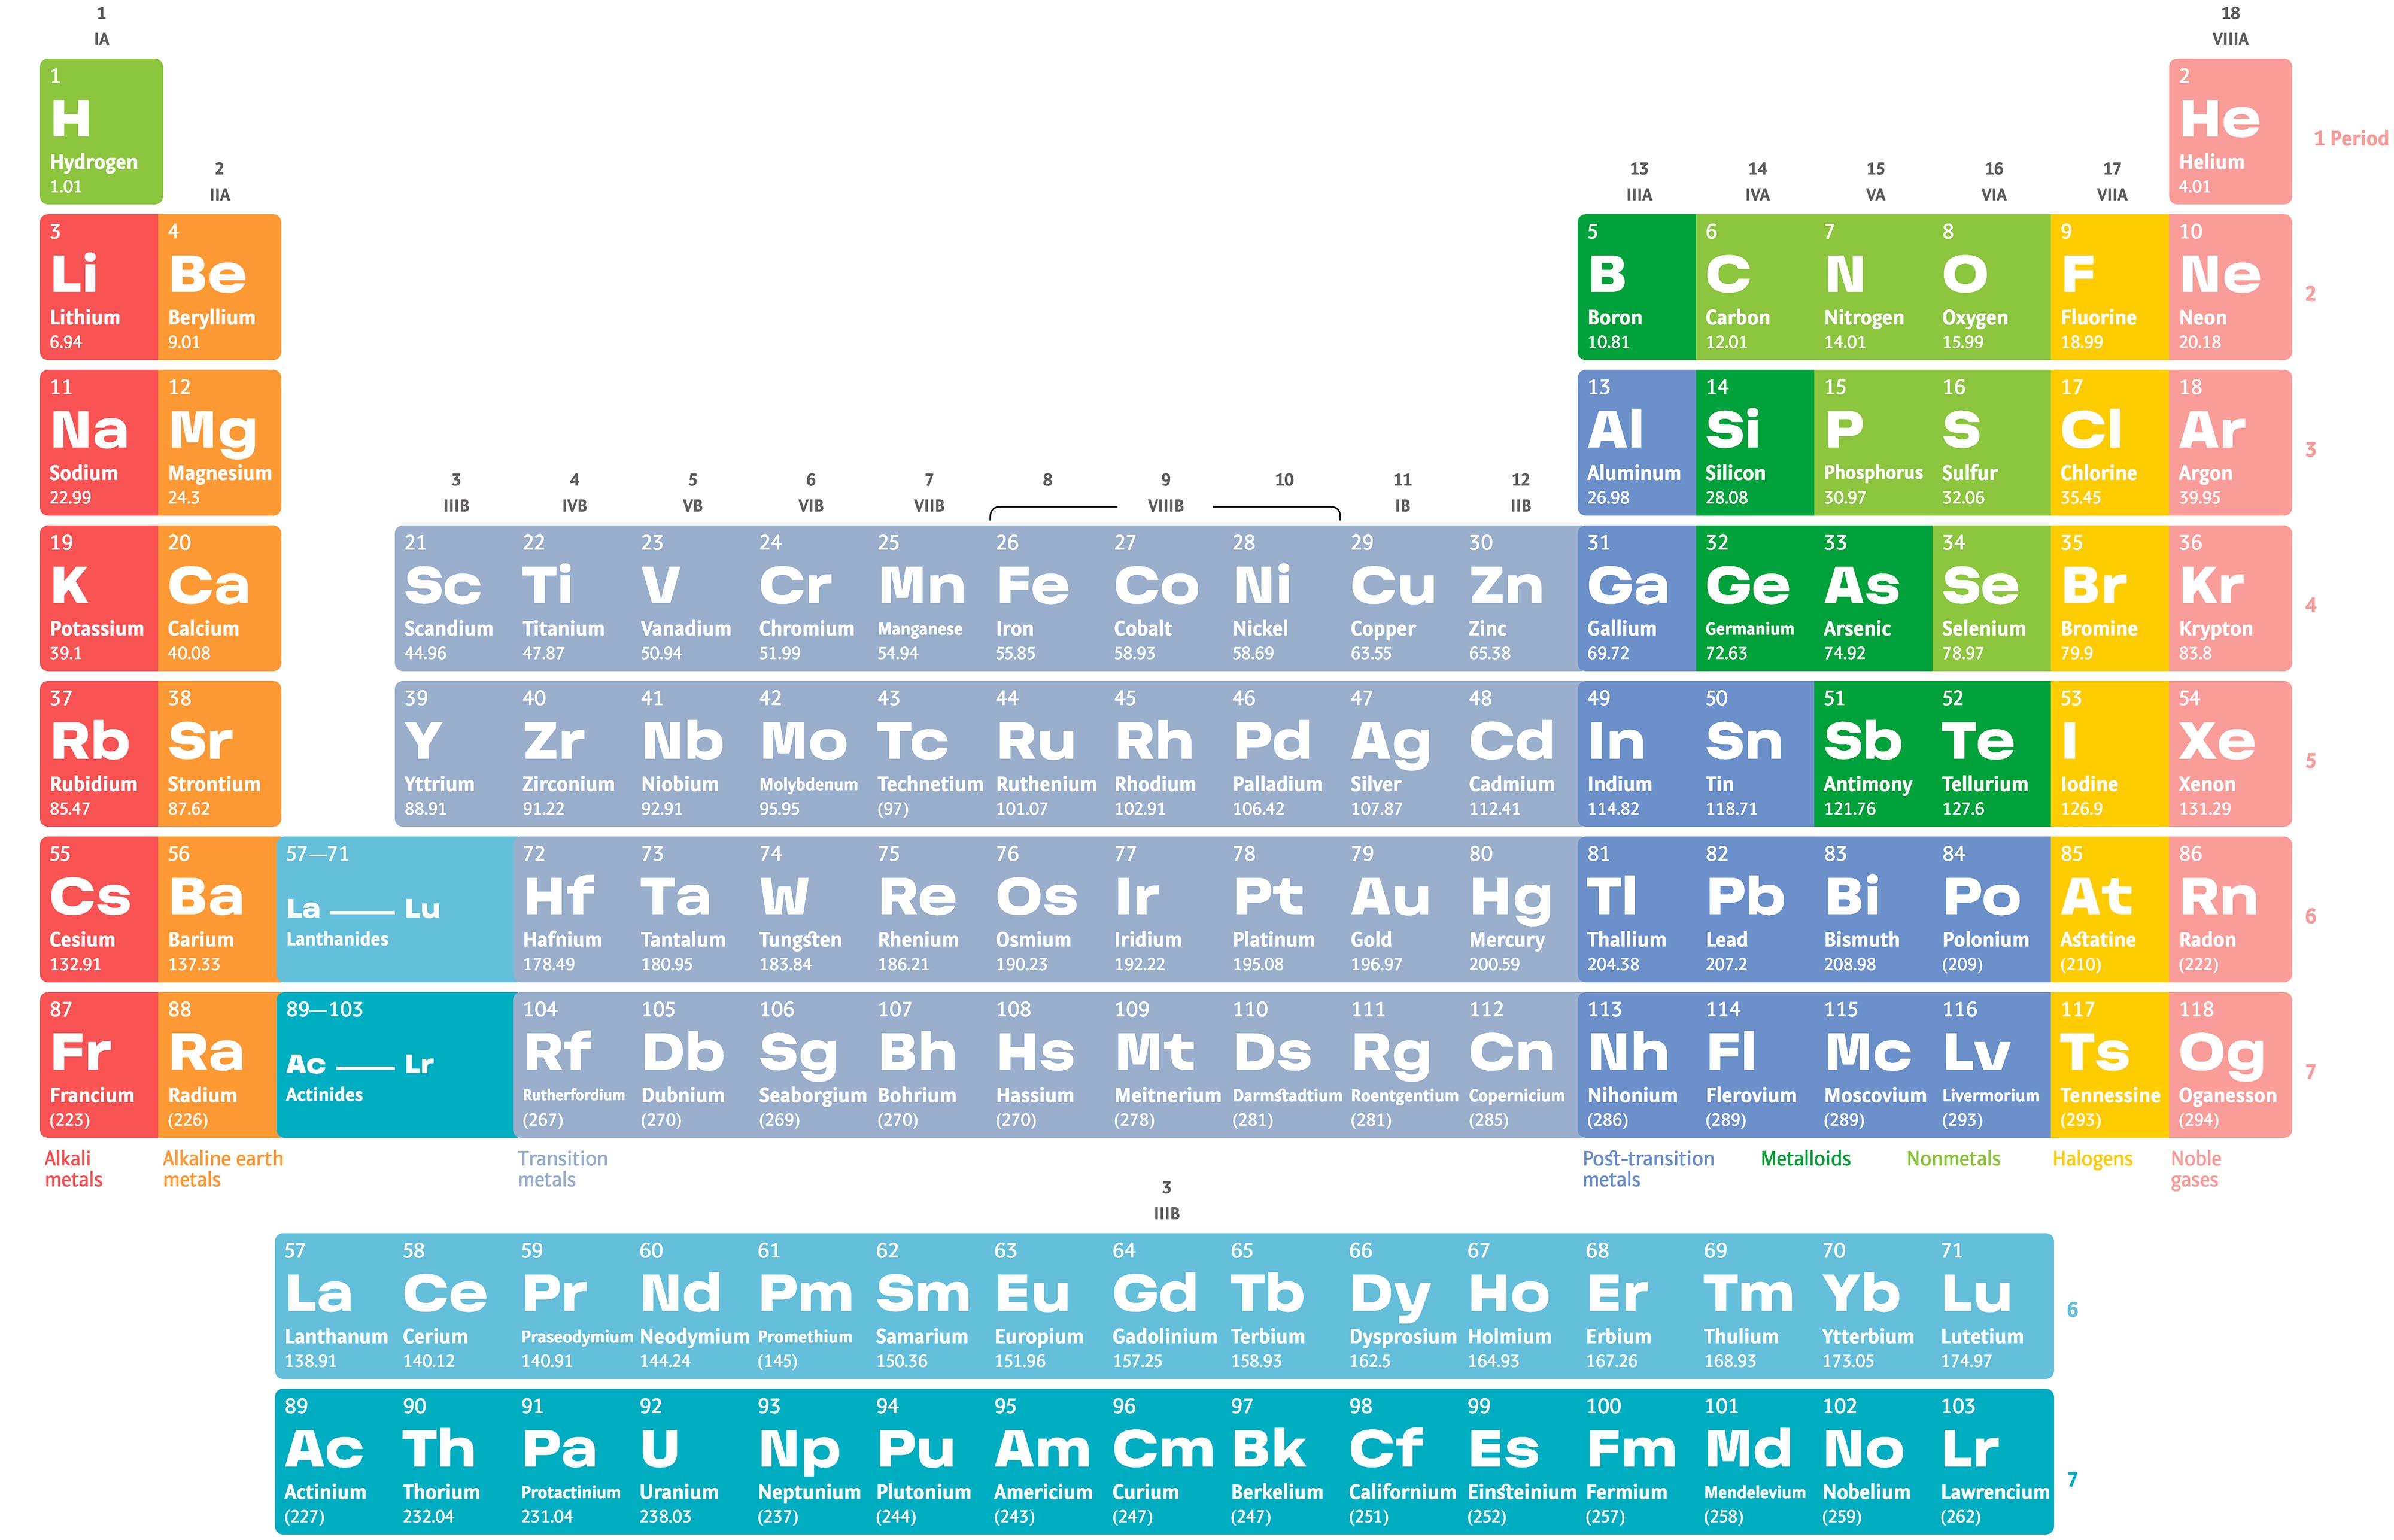
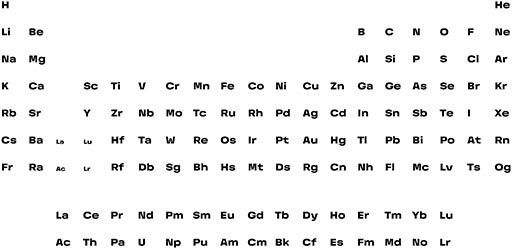
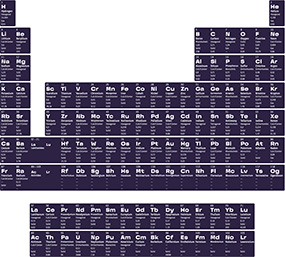
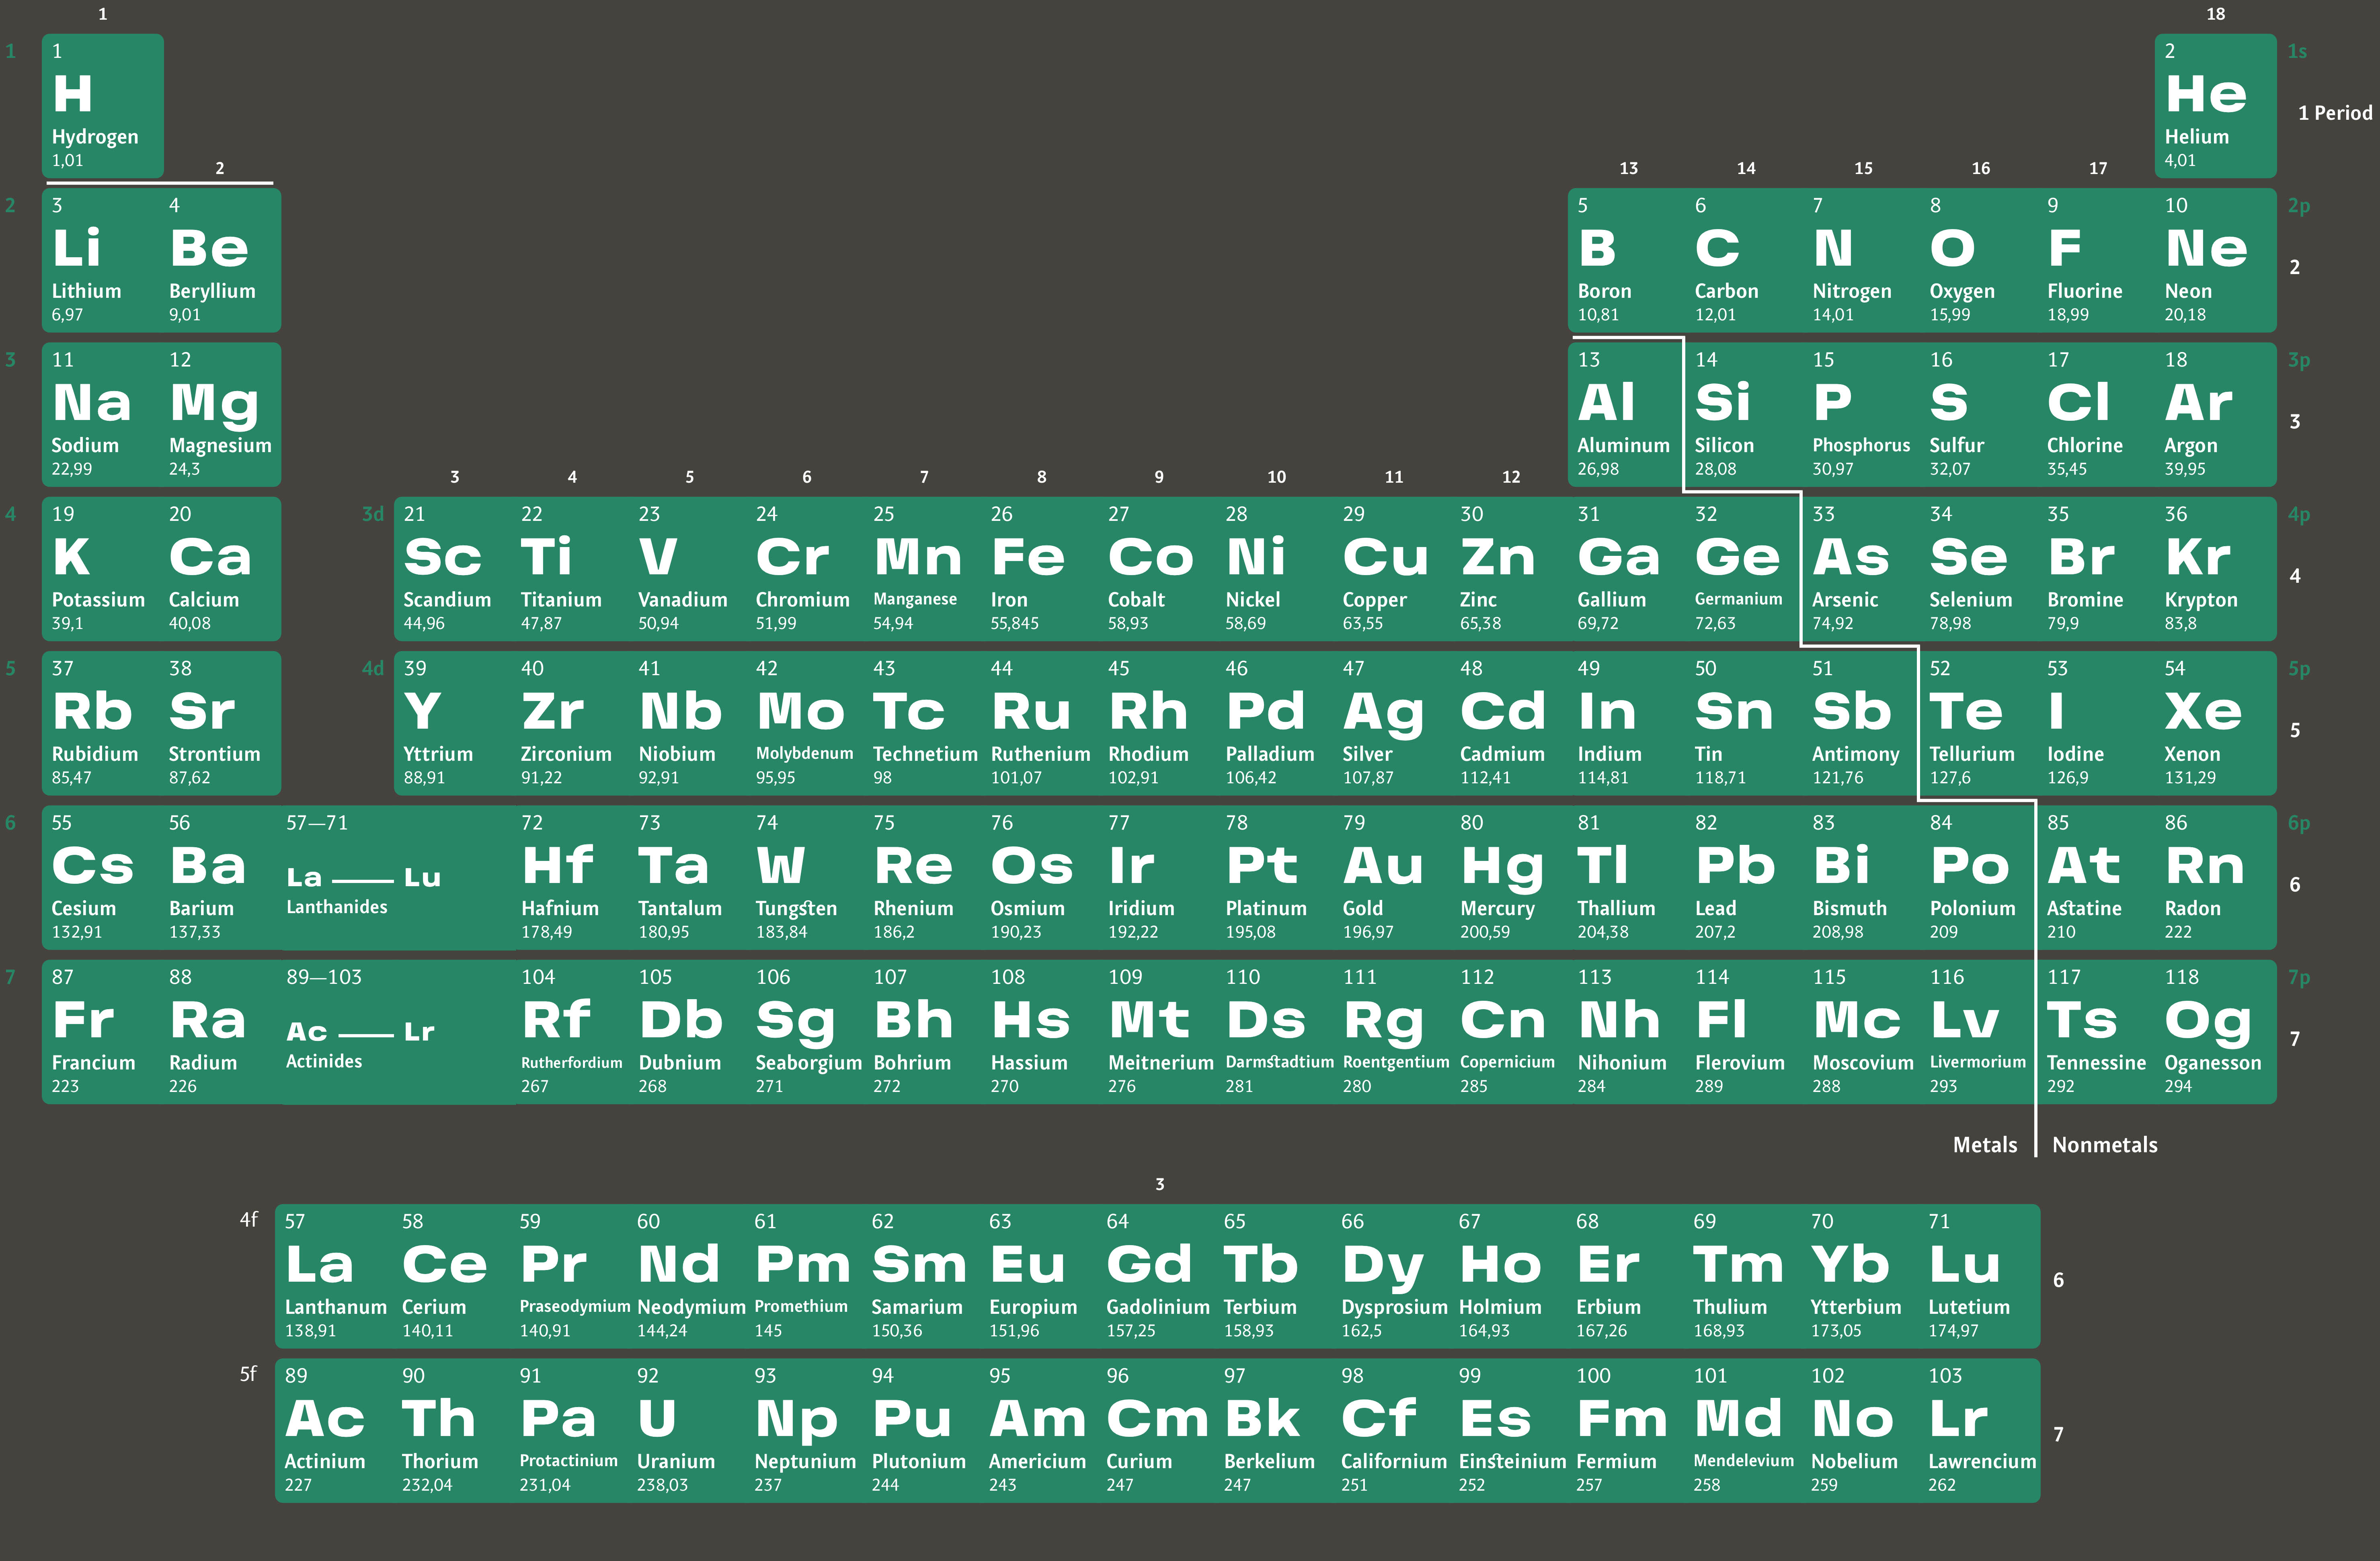
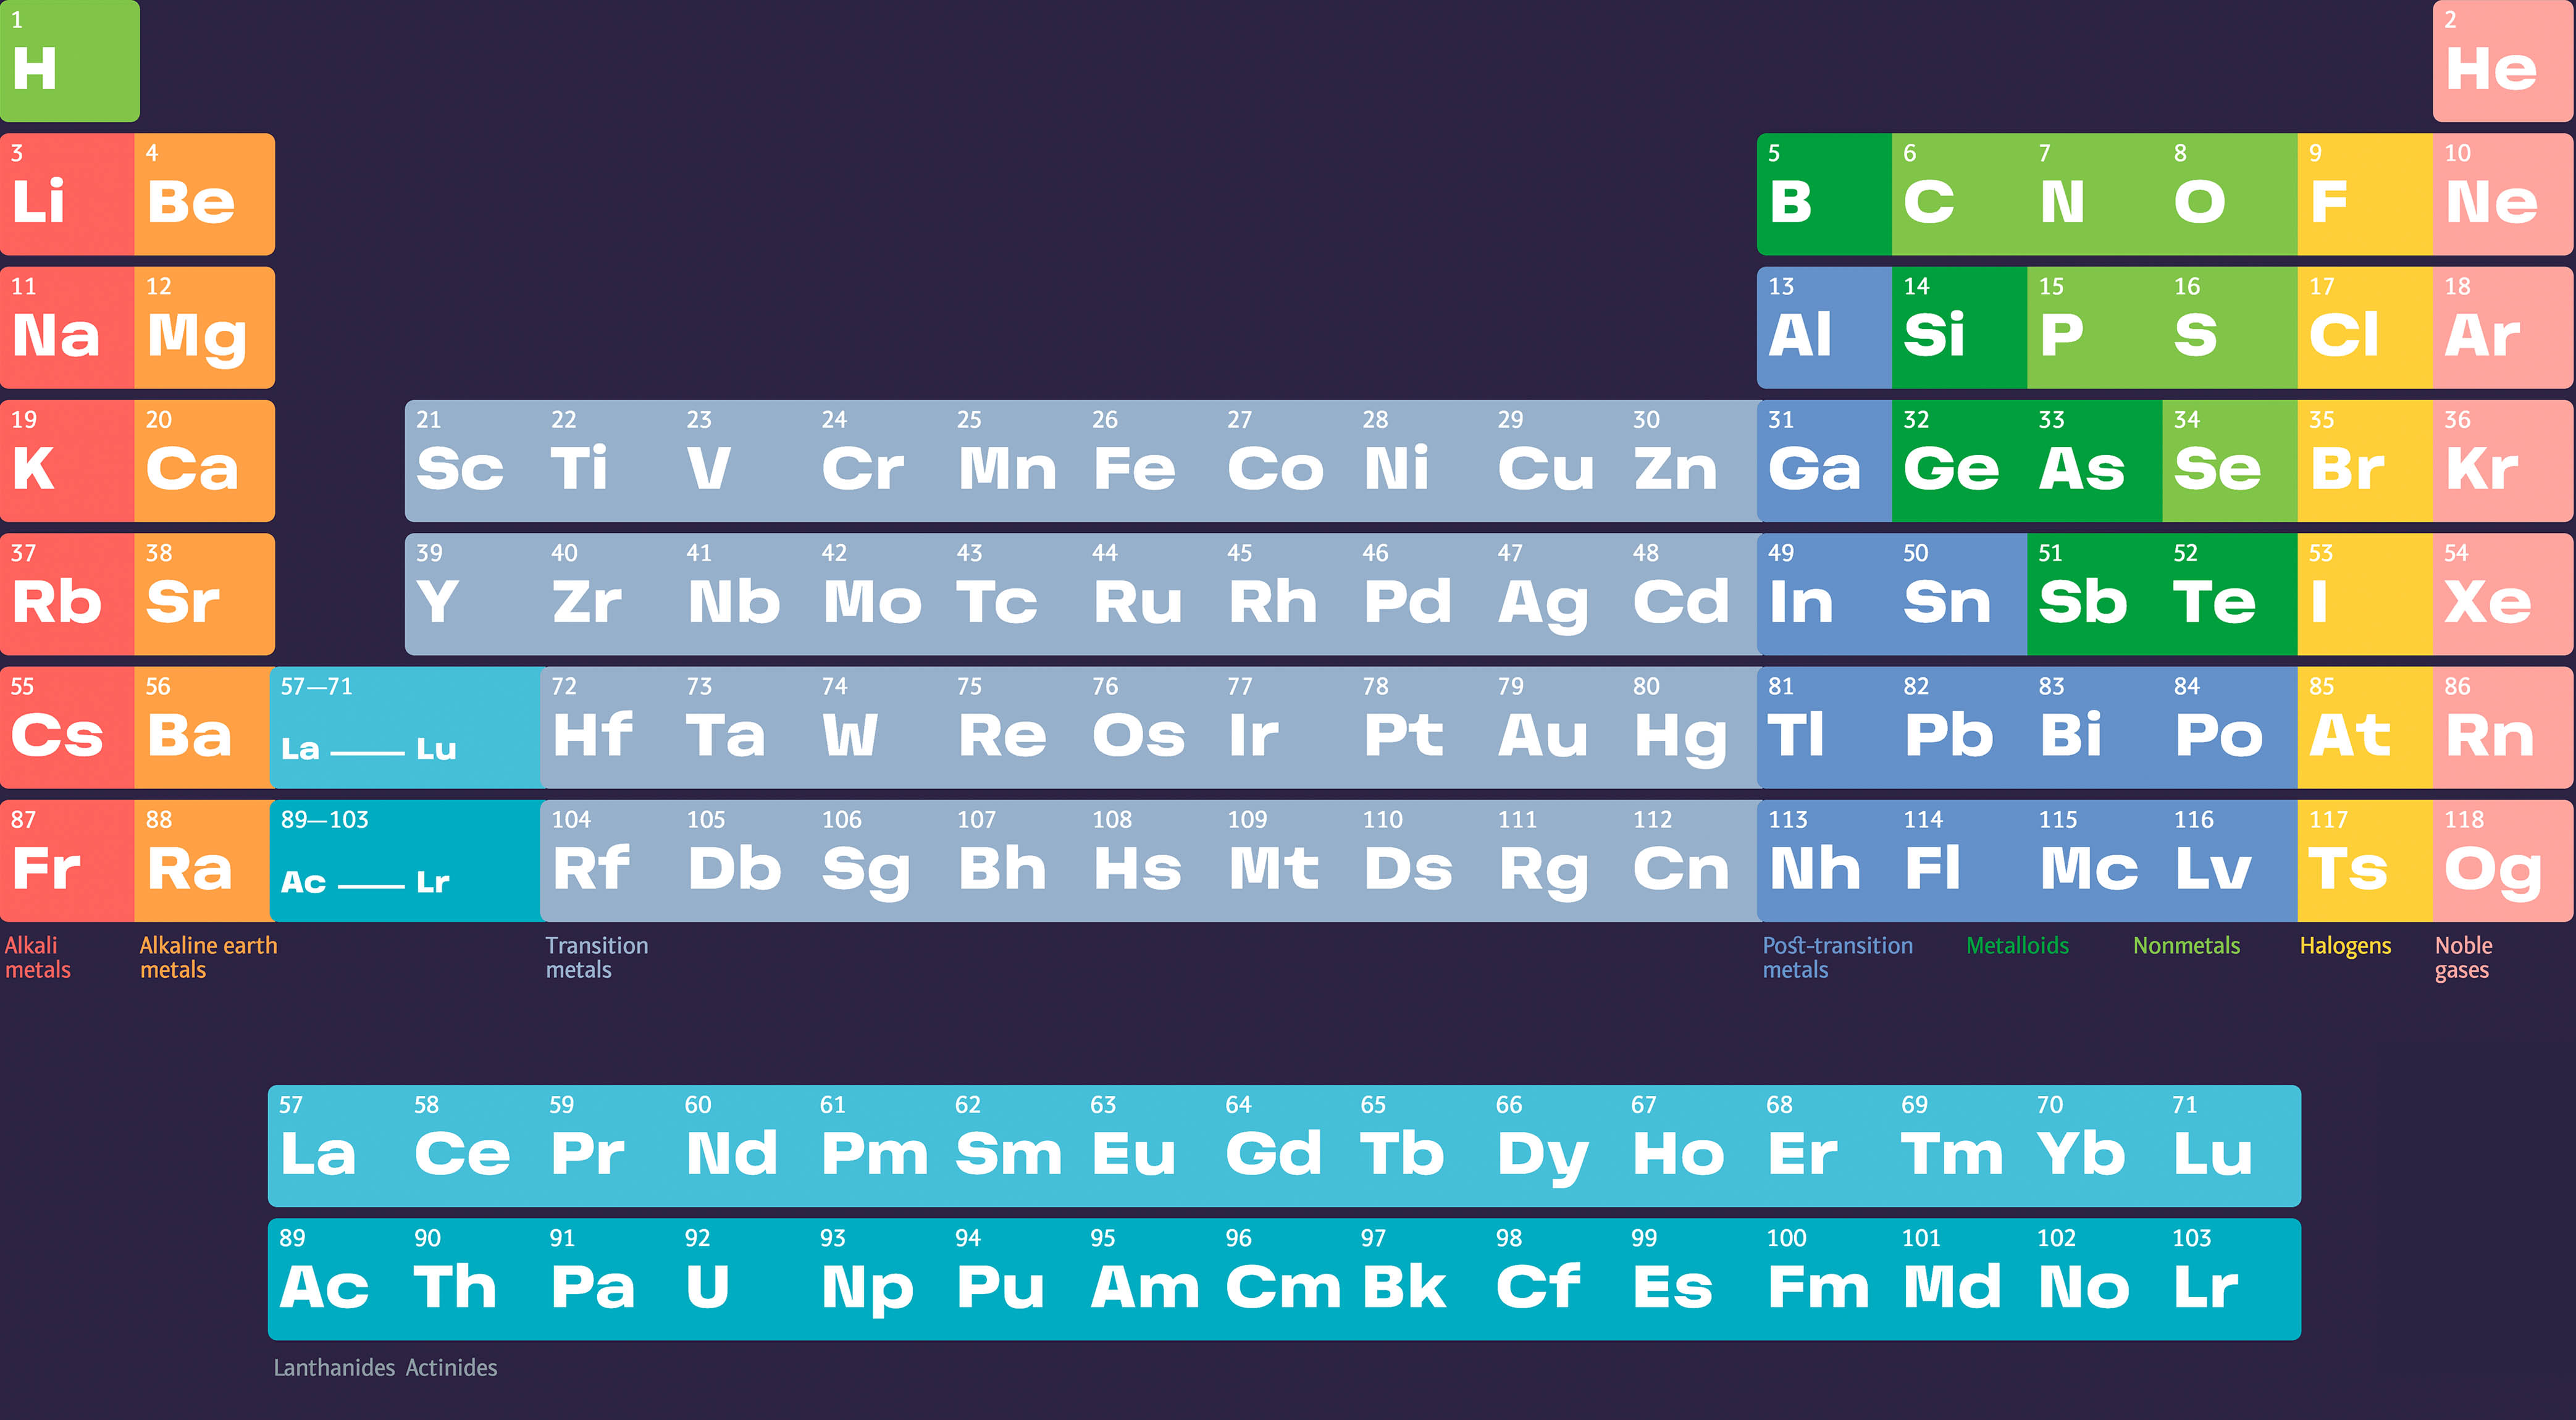
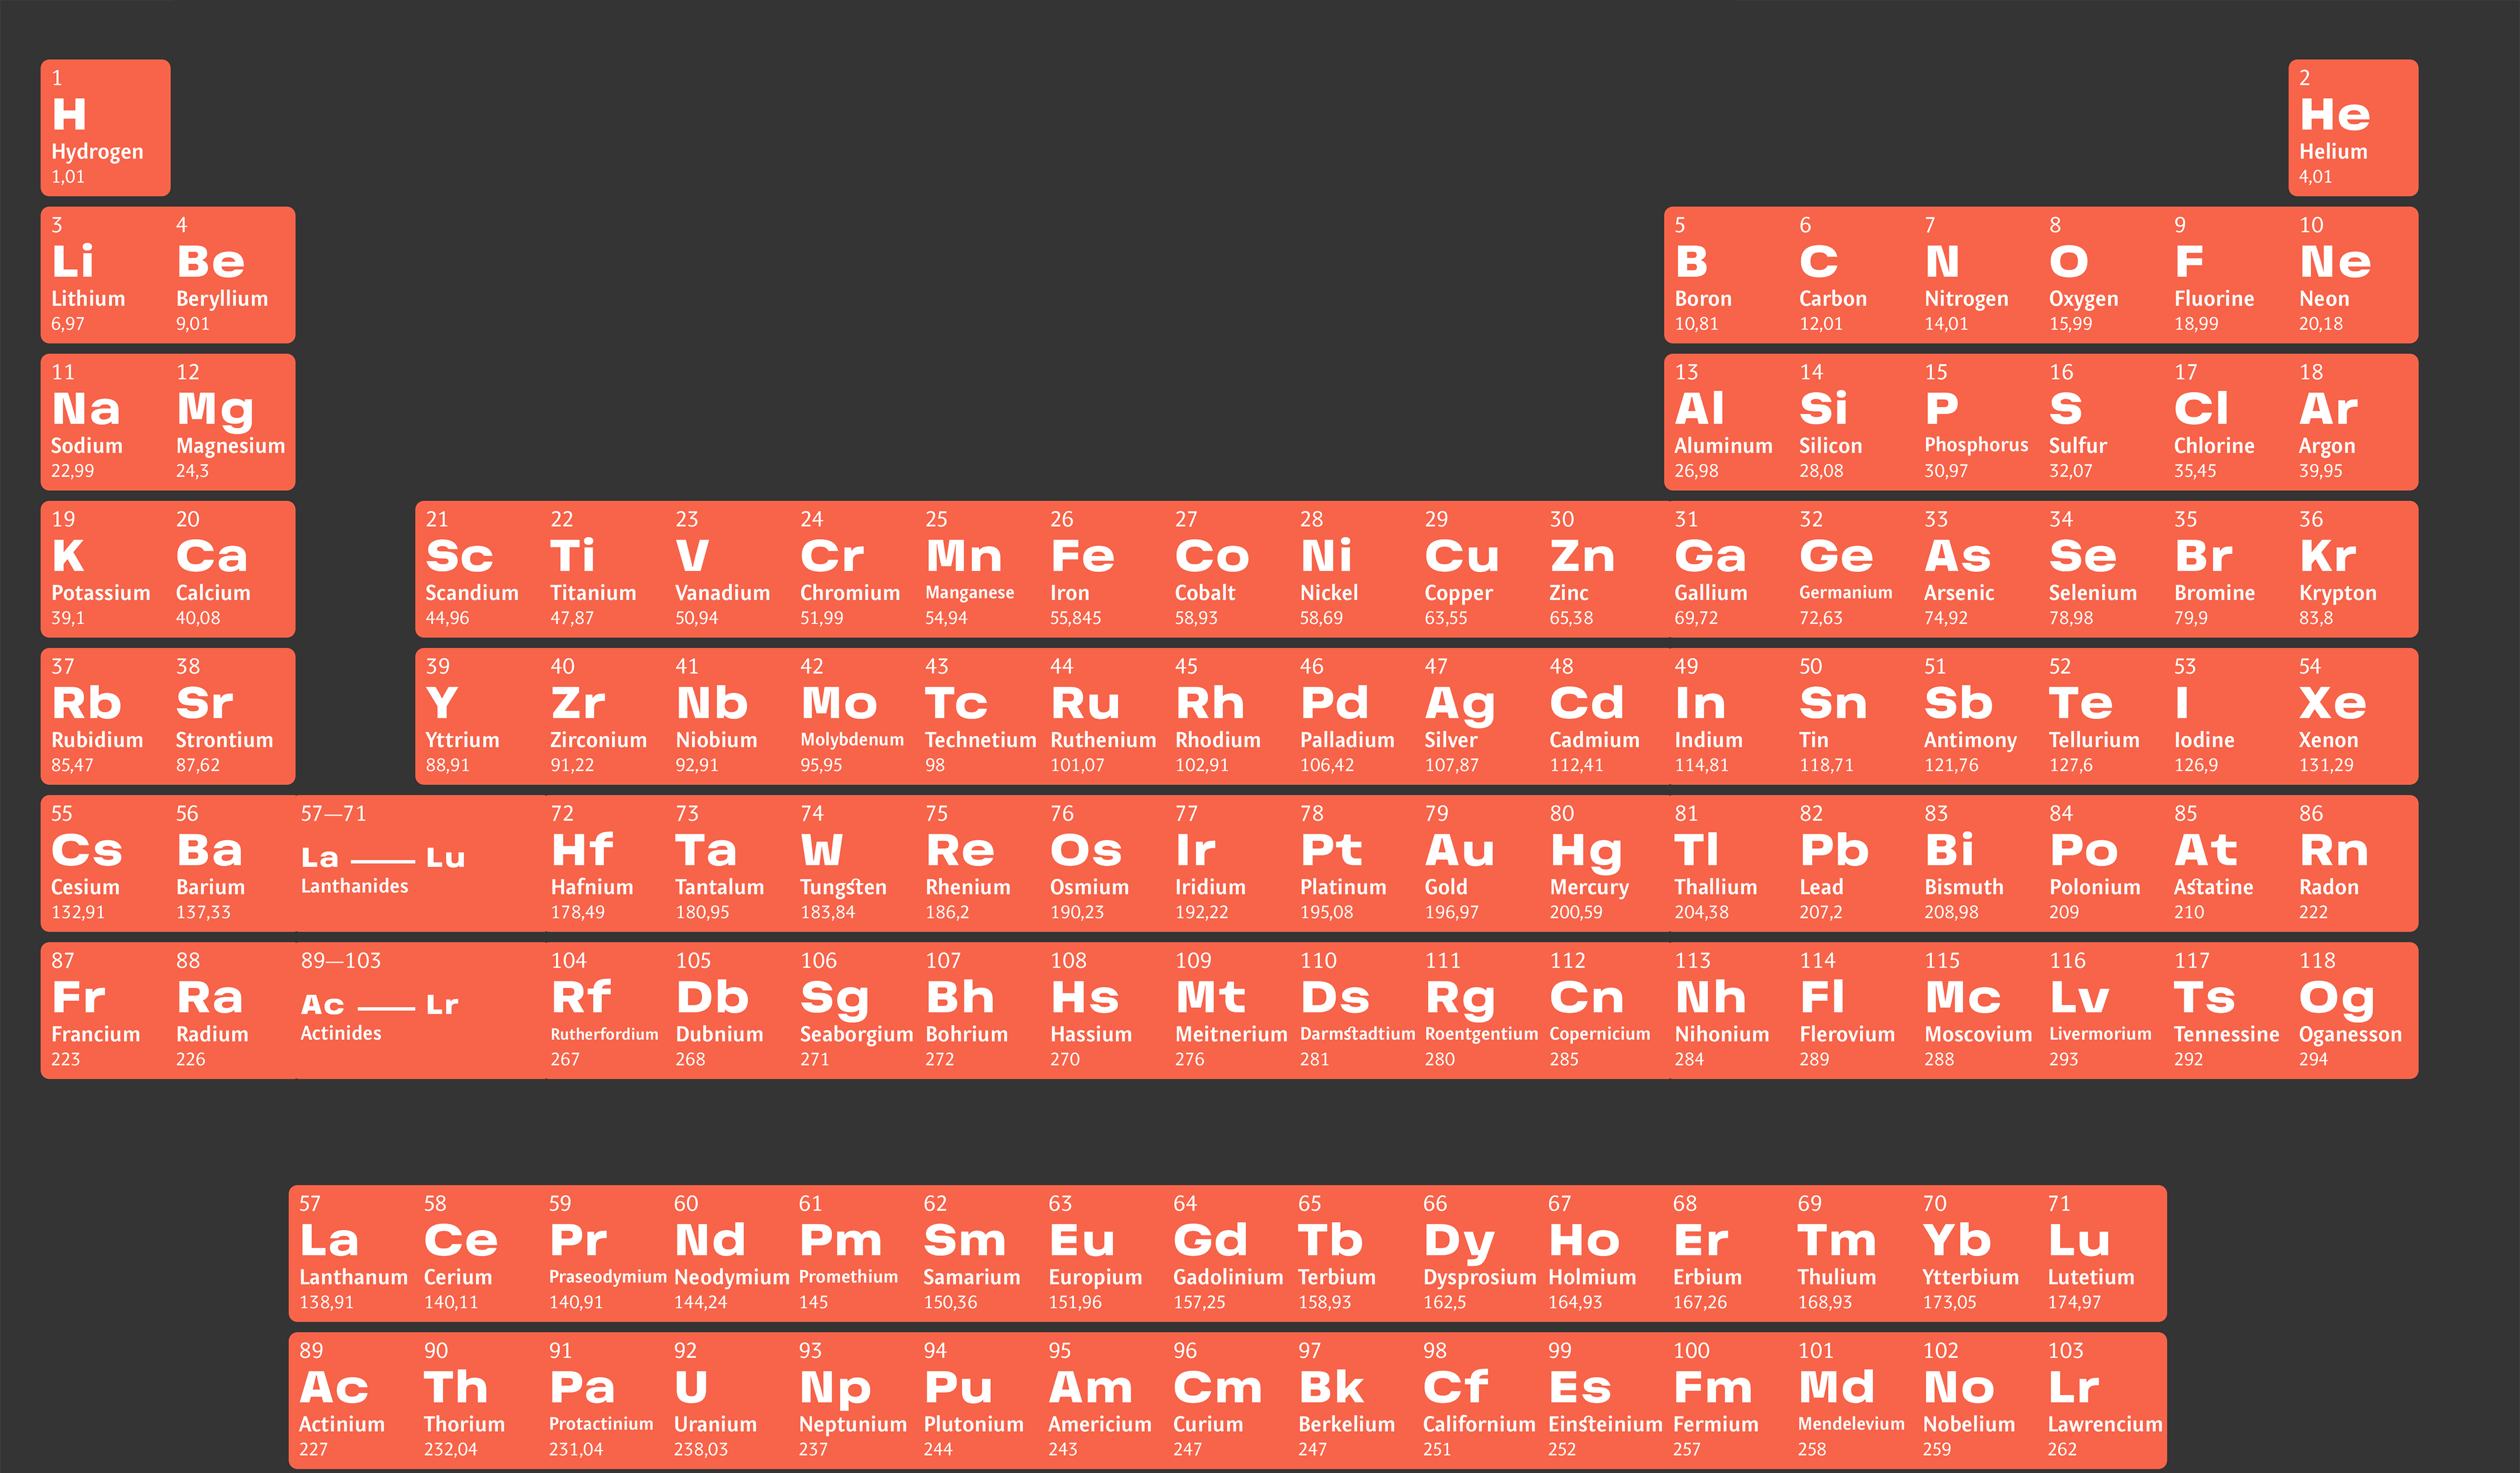
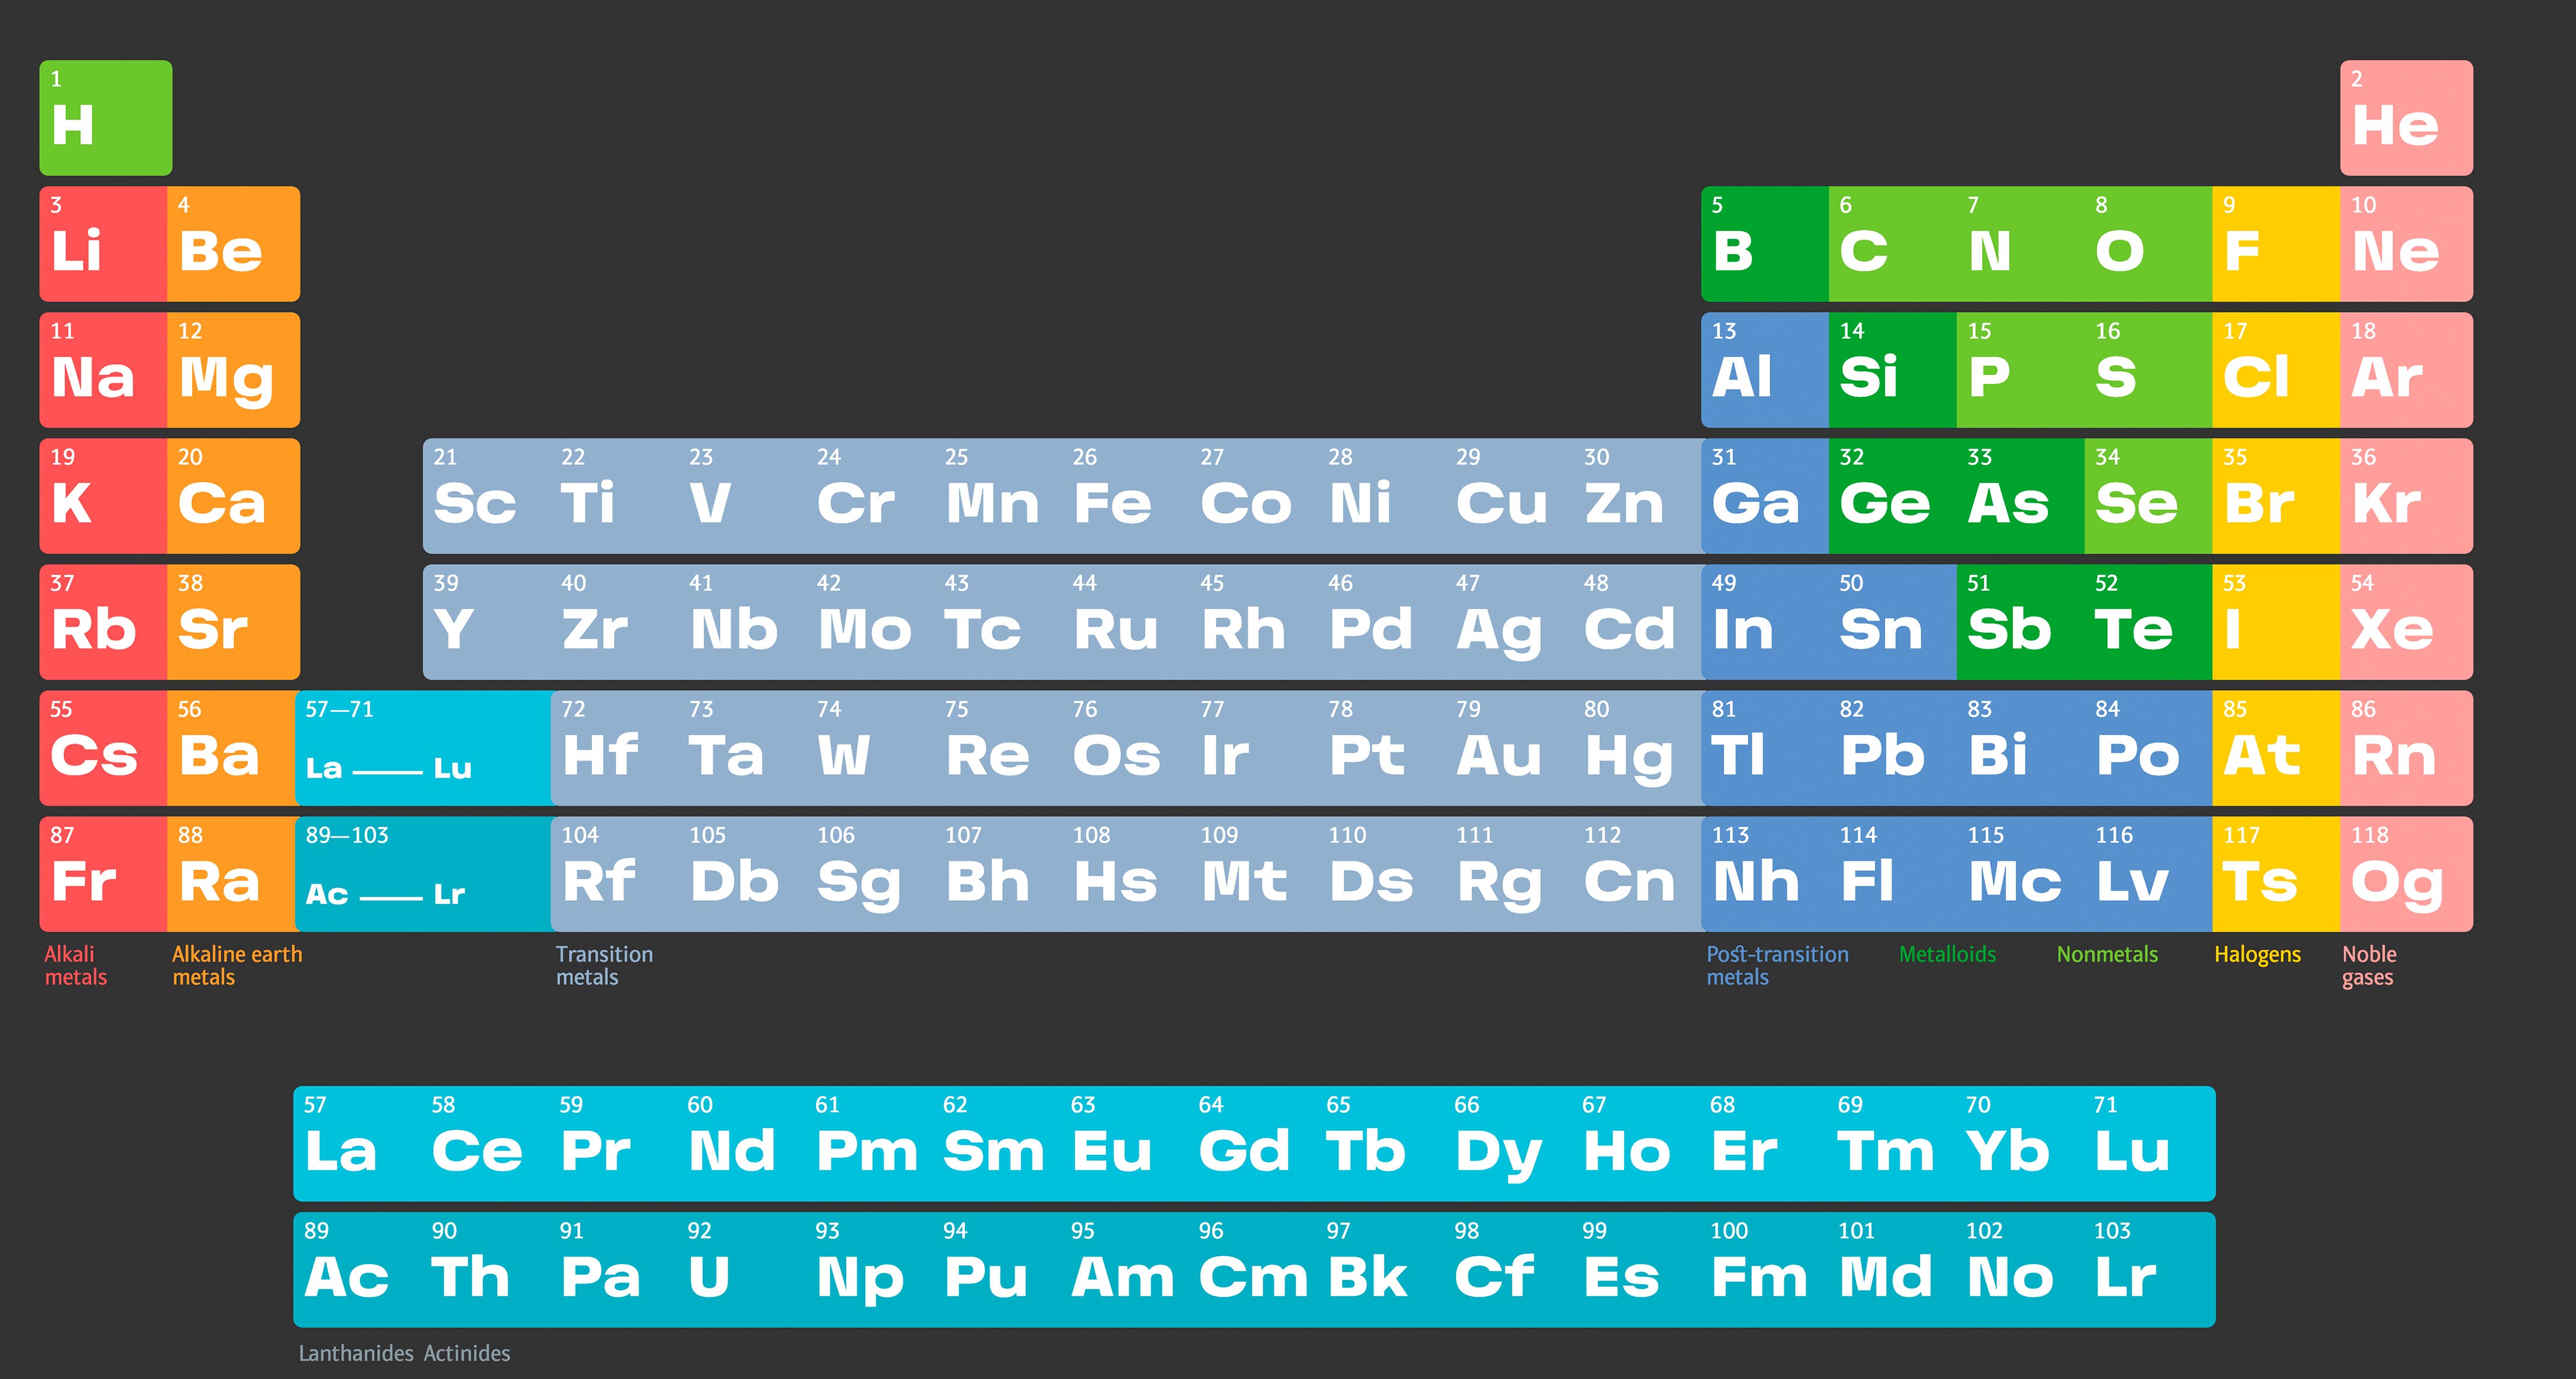
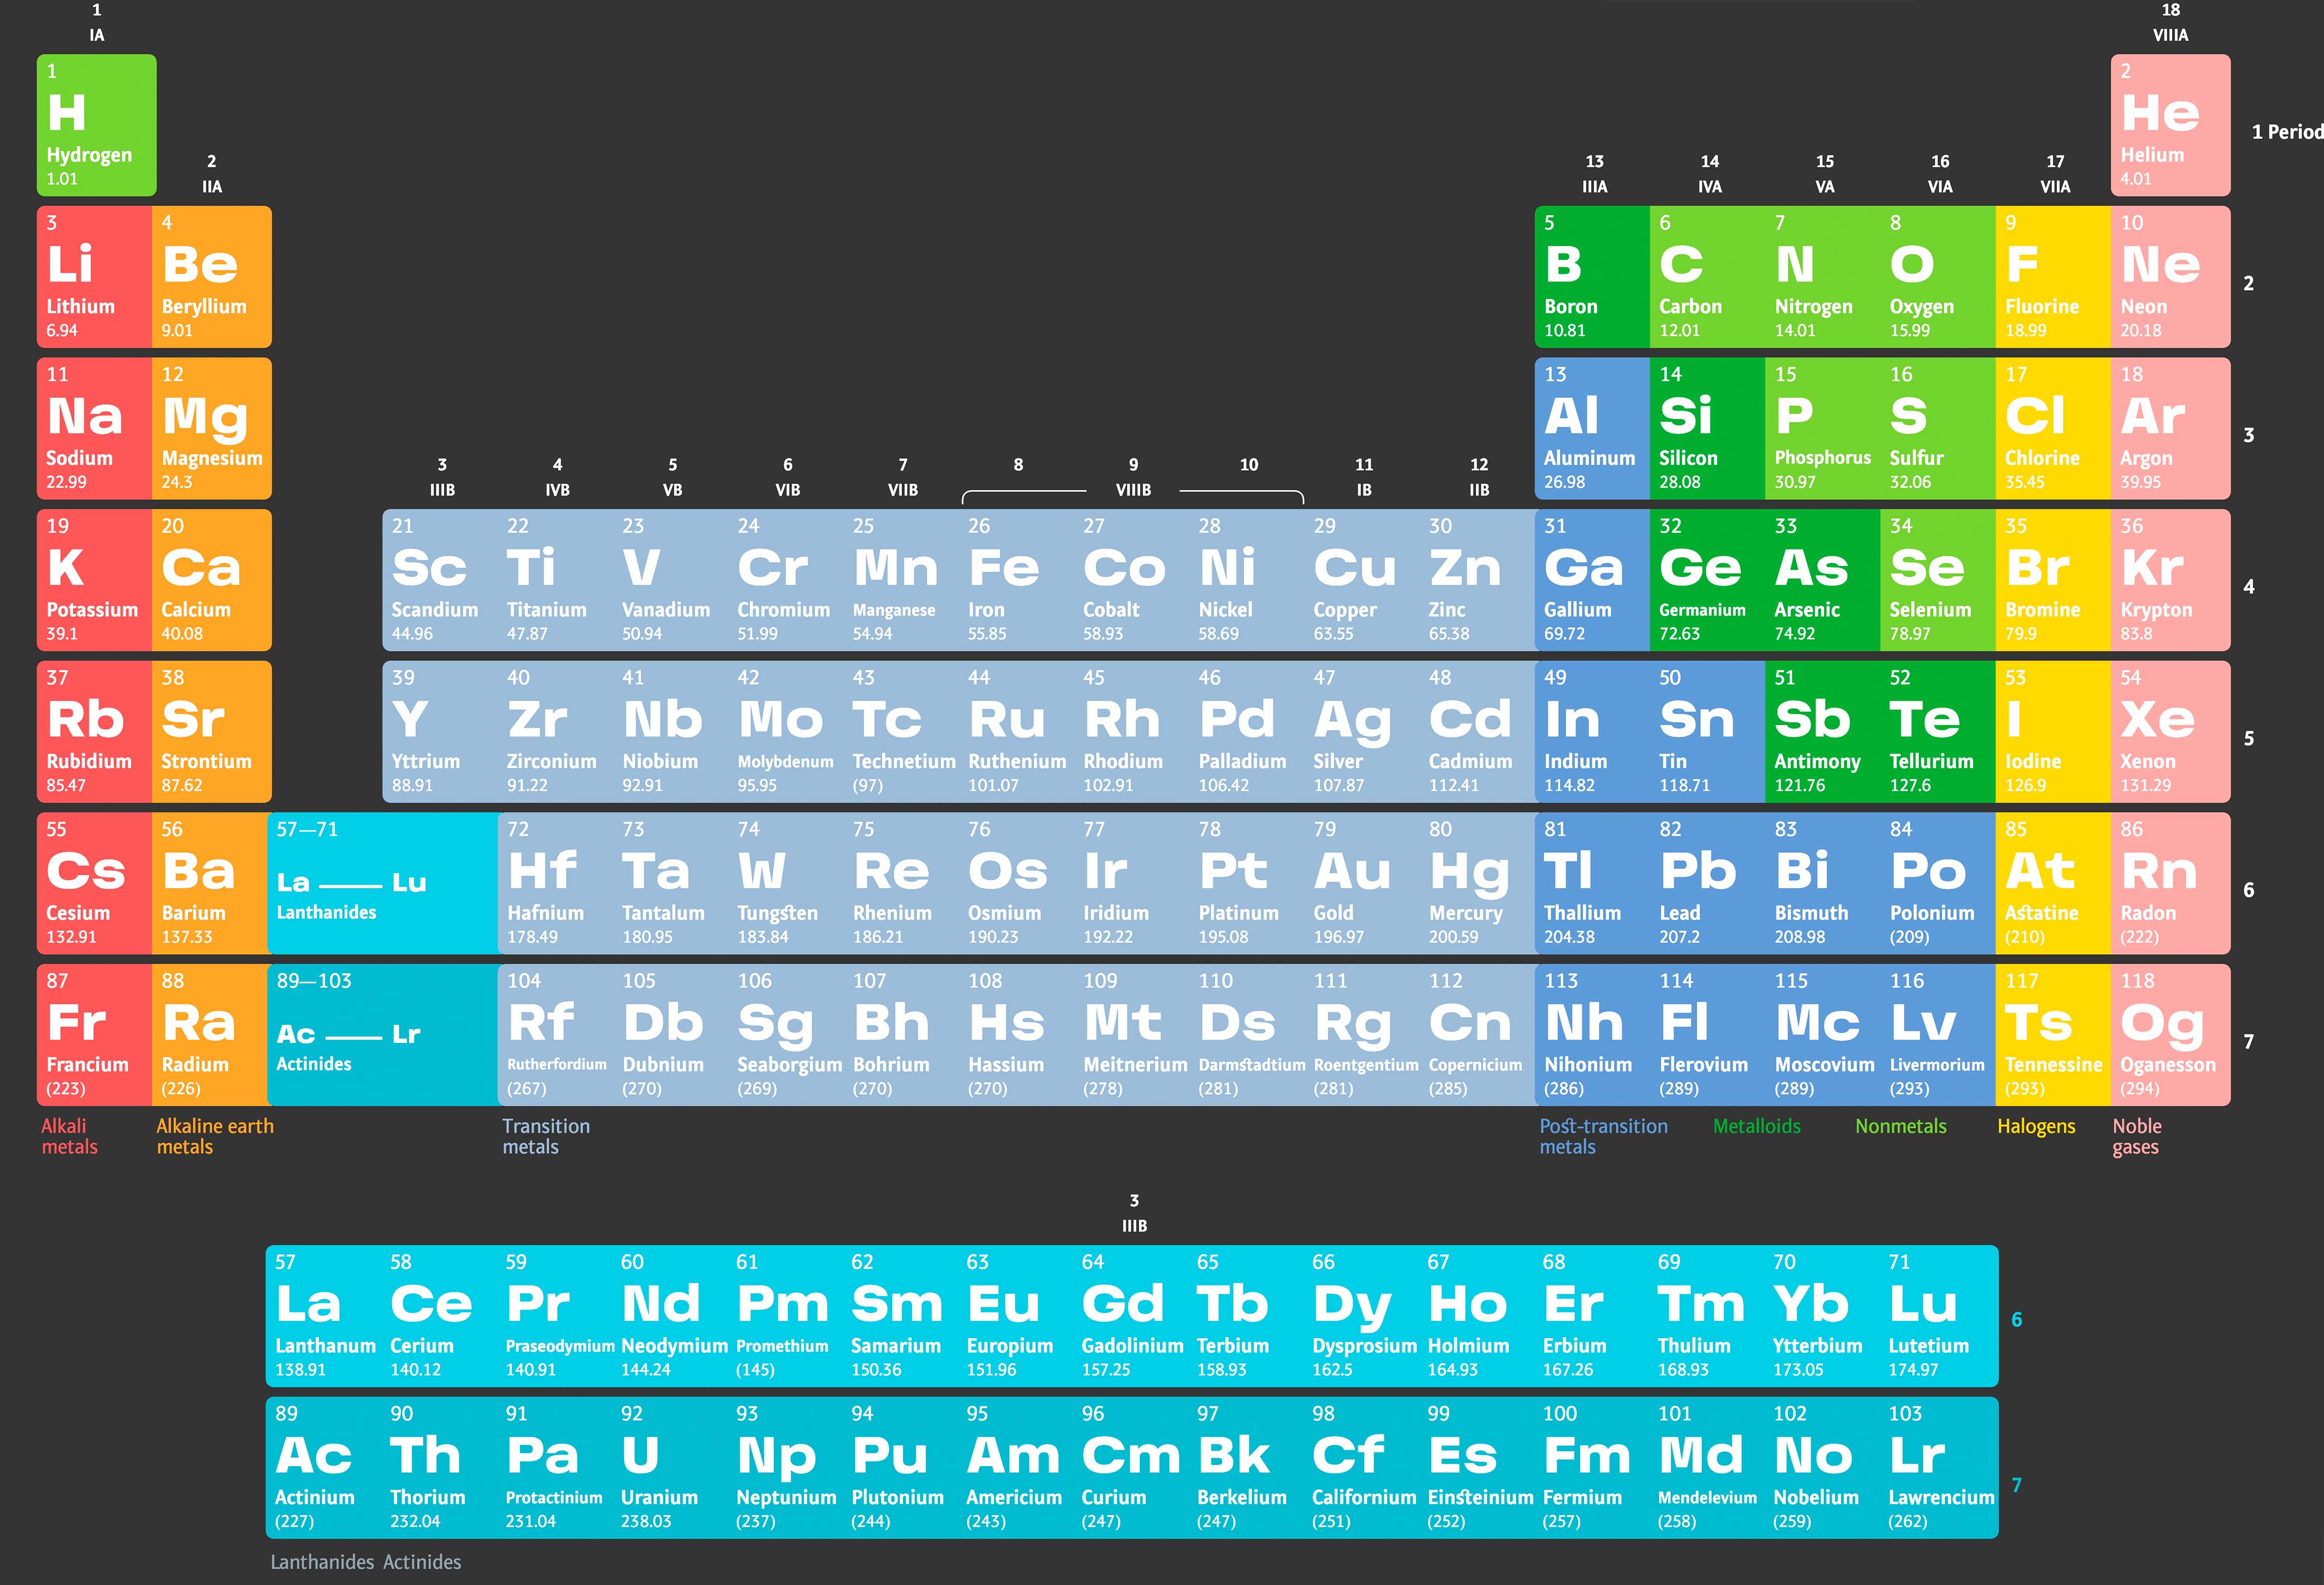
Users can customize how the table looks by selecting cell colors and background, and toggling group labels, periods, atomic orbitals, the legend, and other elements. In the right hands, the table can be turned into a beautiful piece of design.
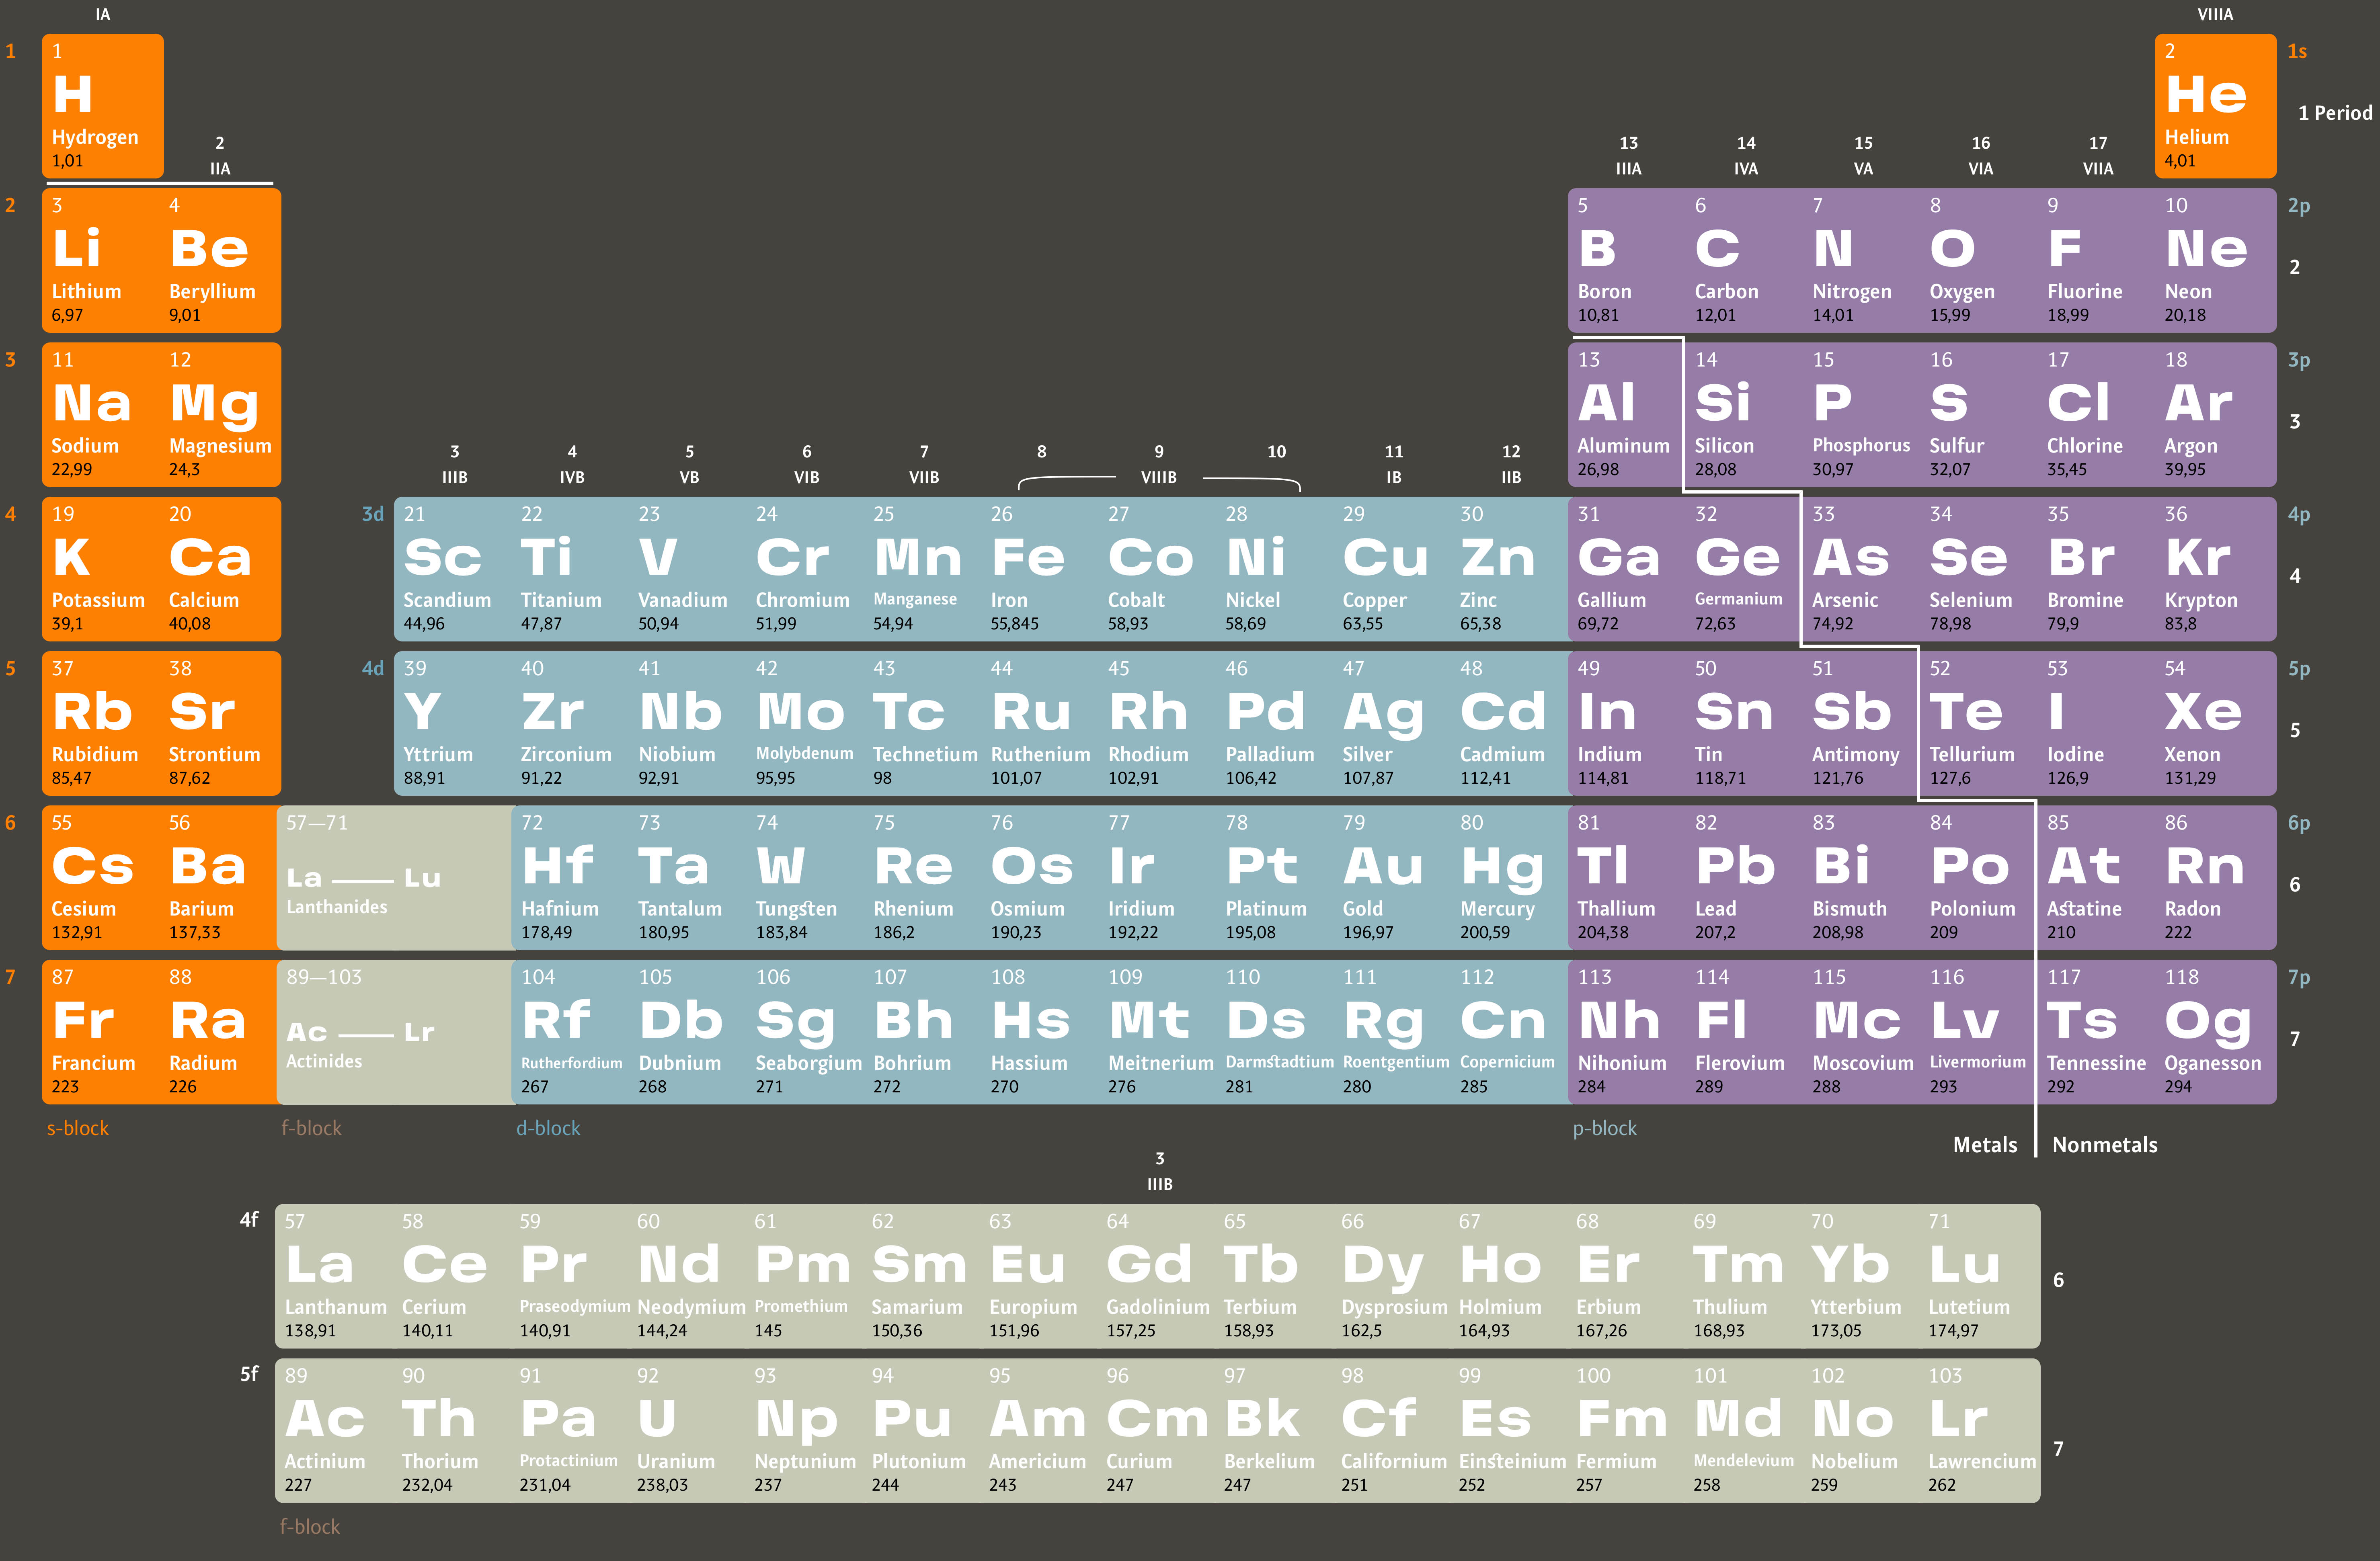
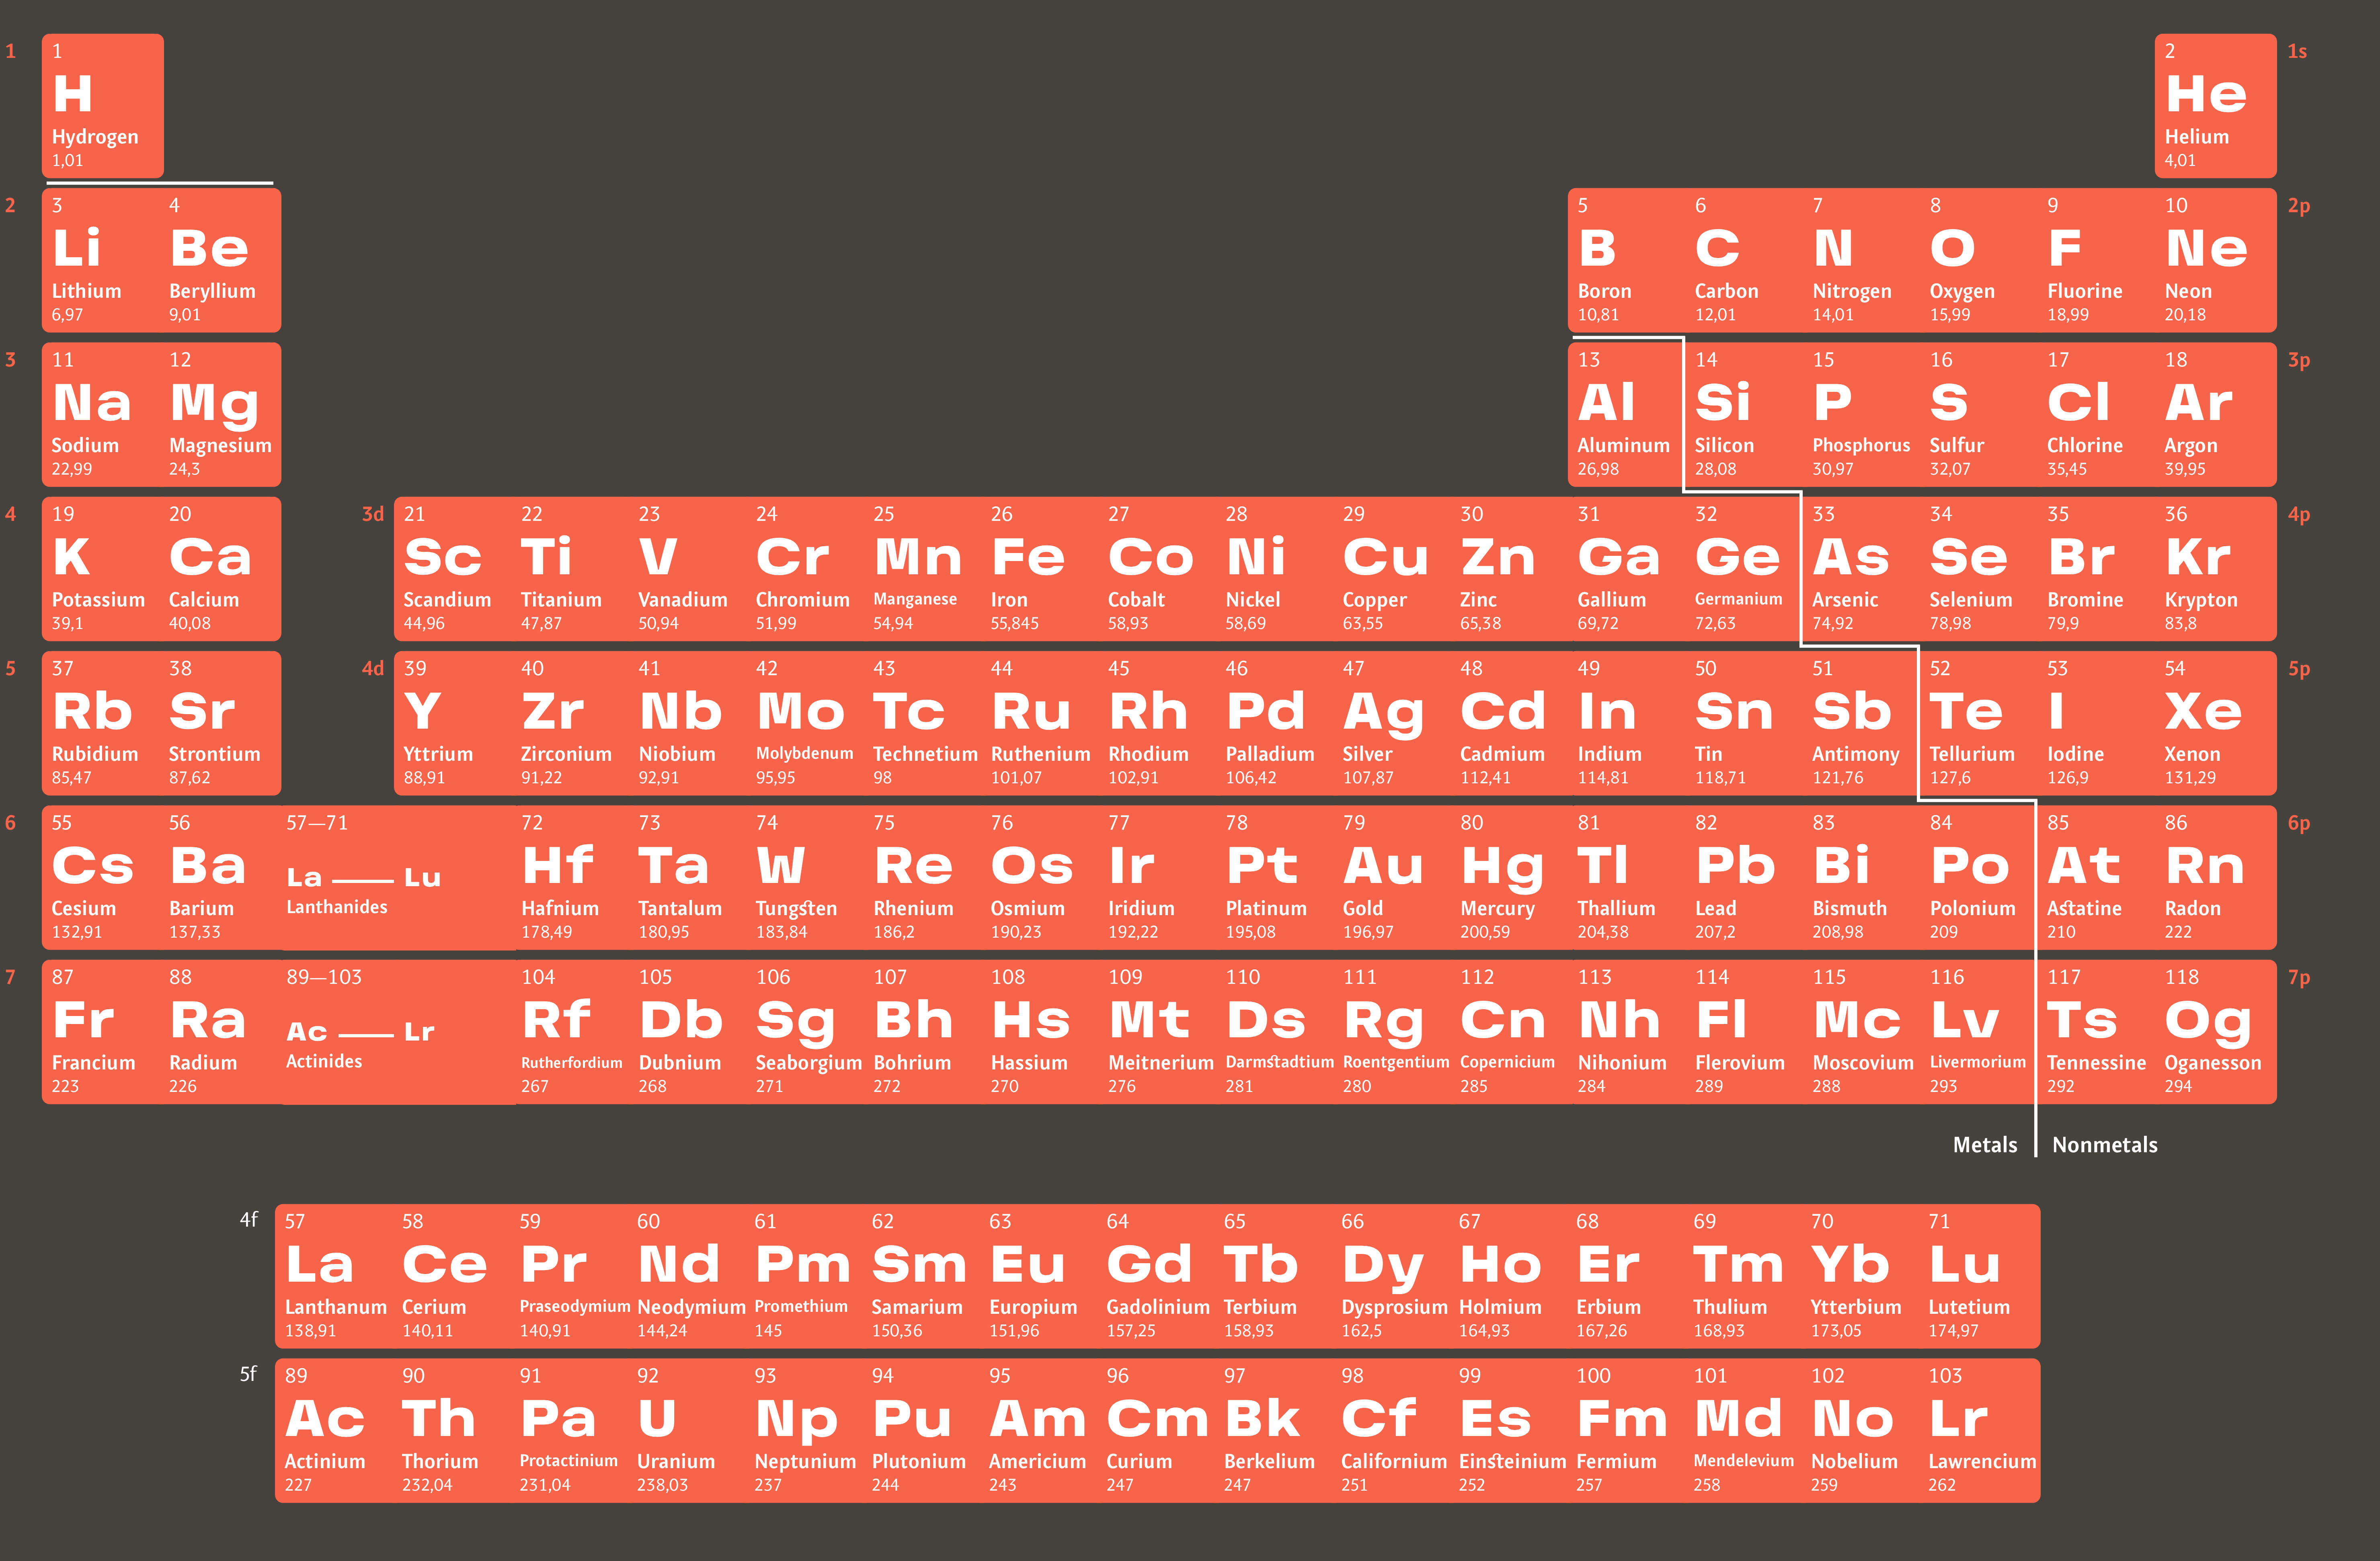
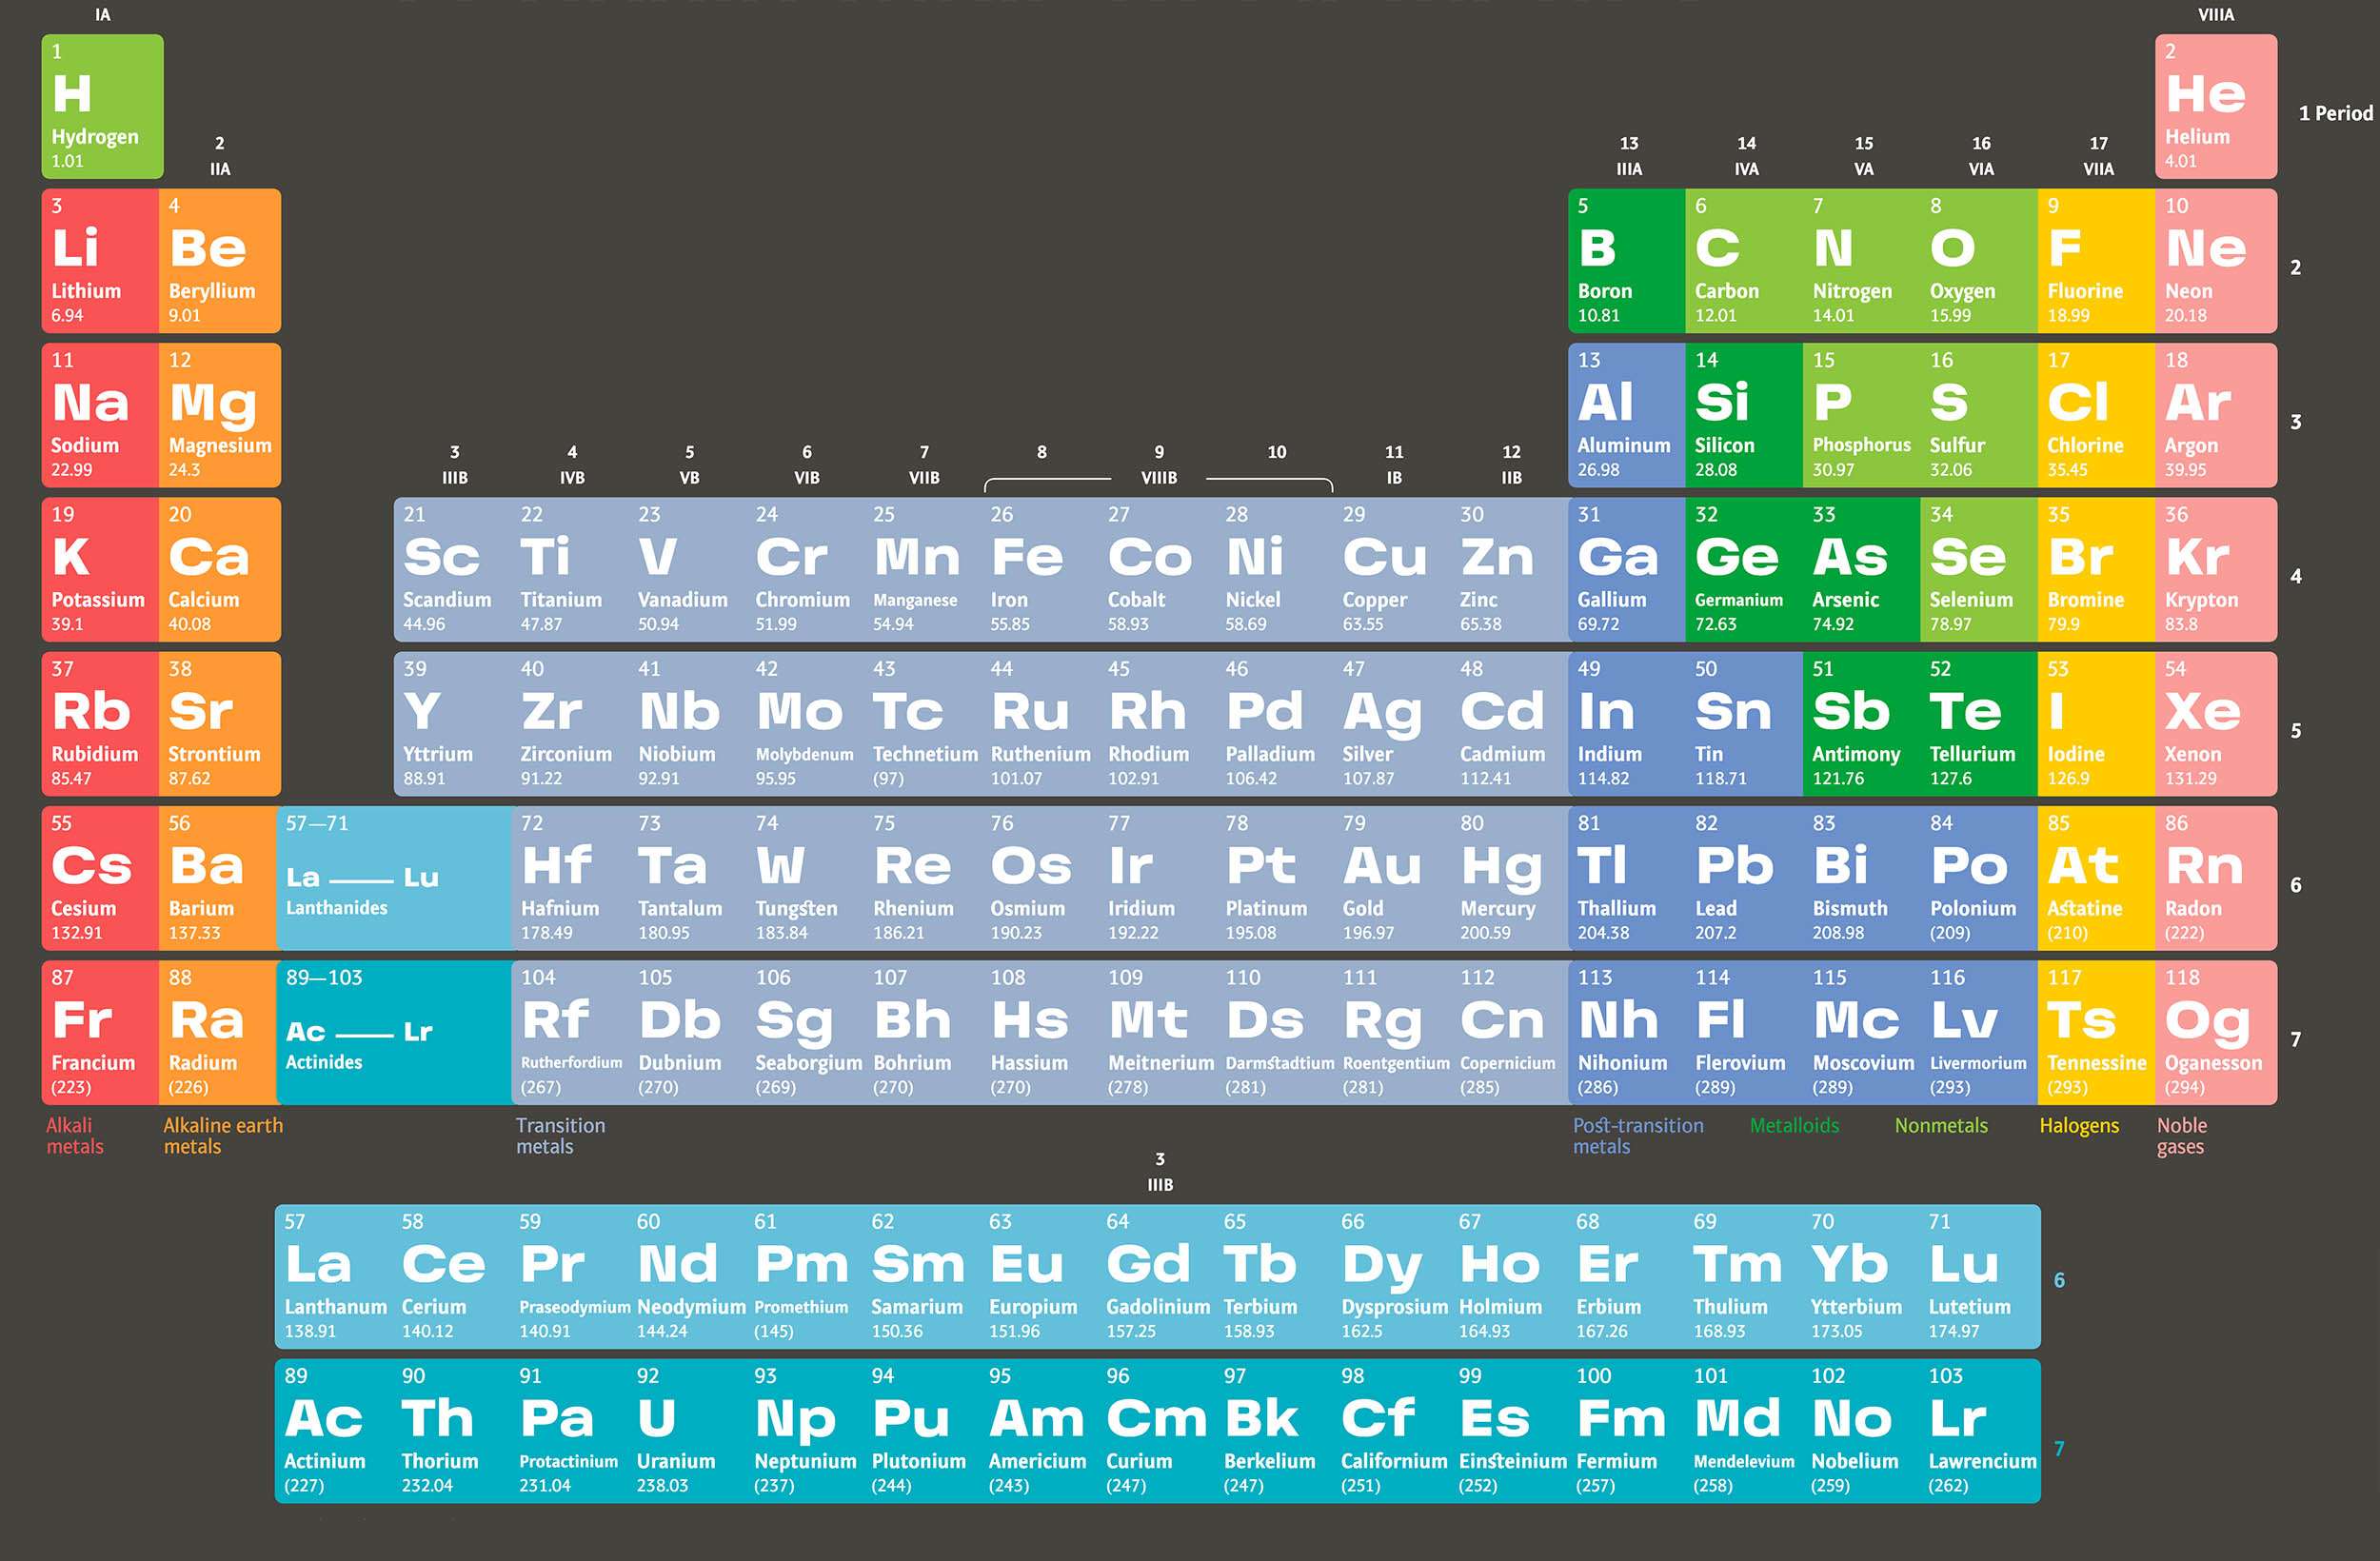
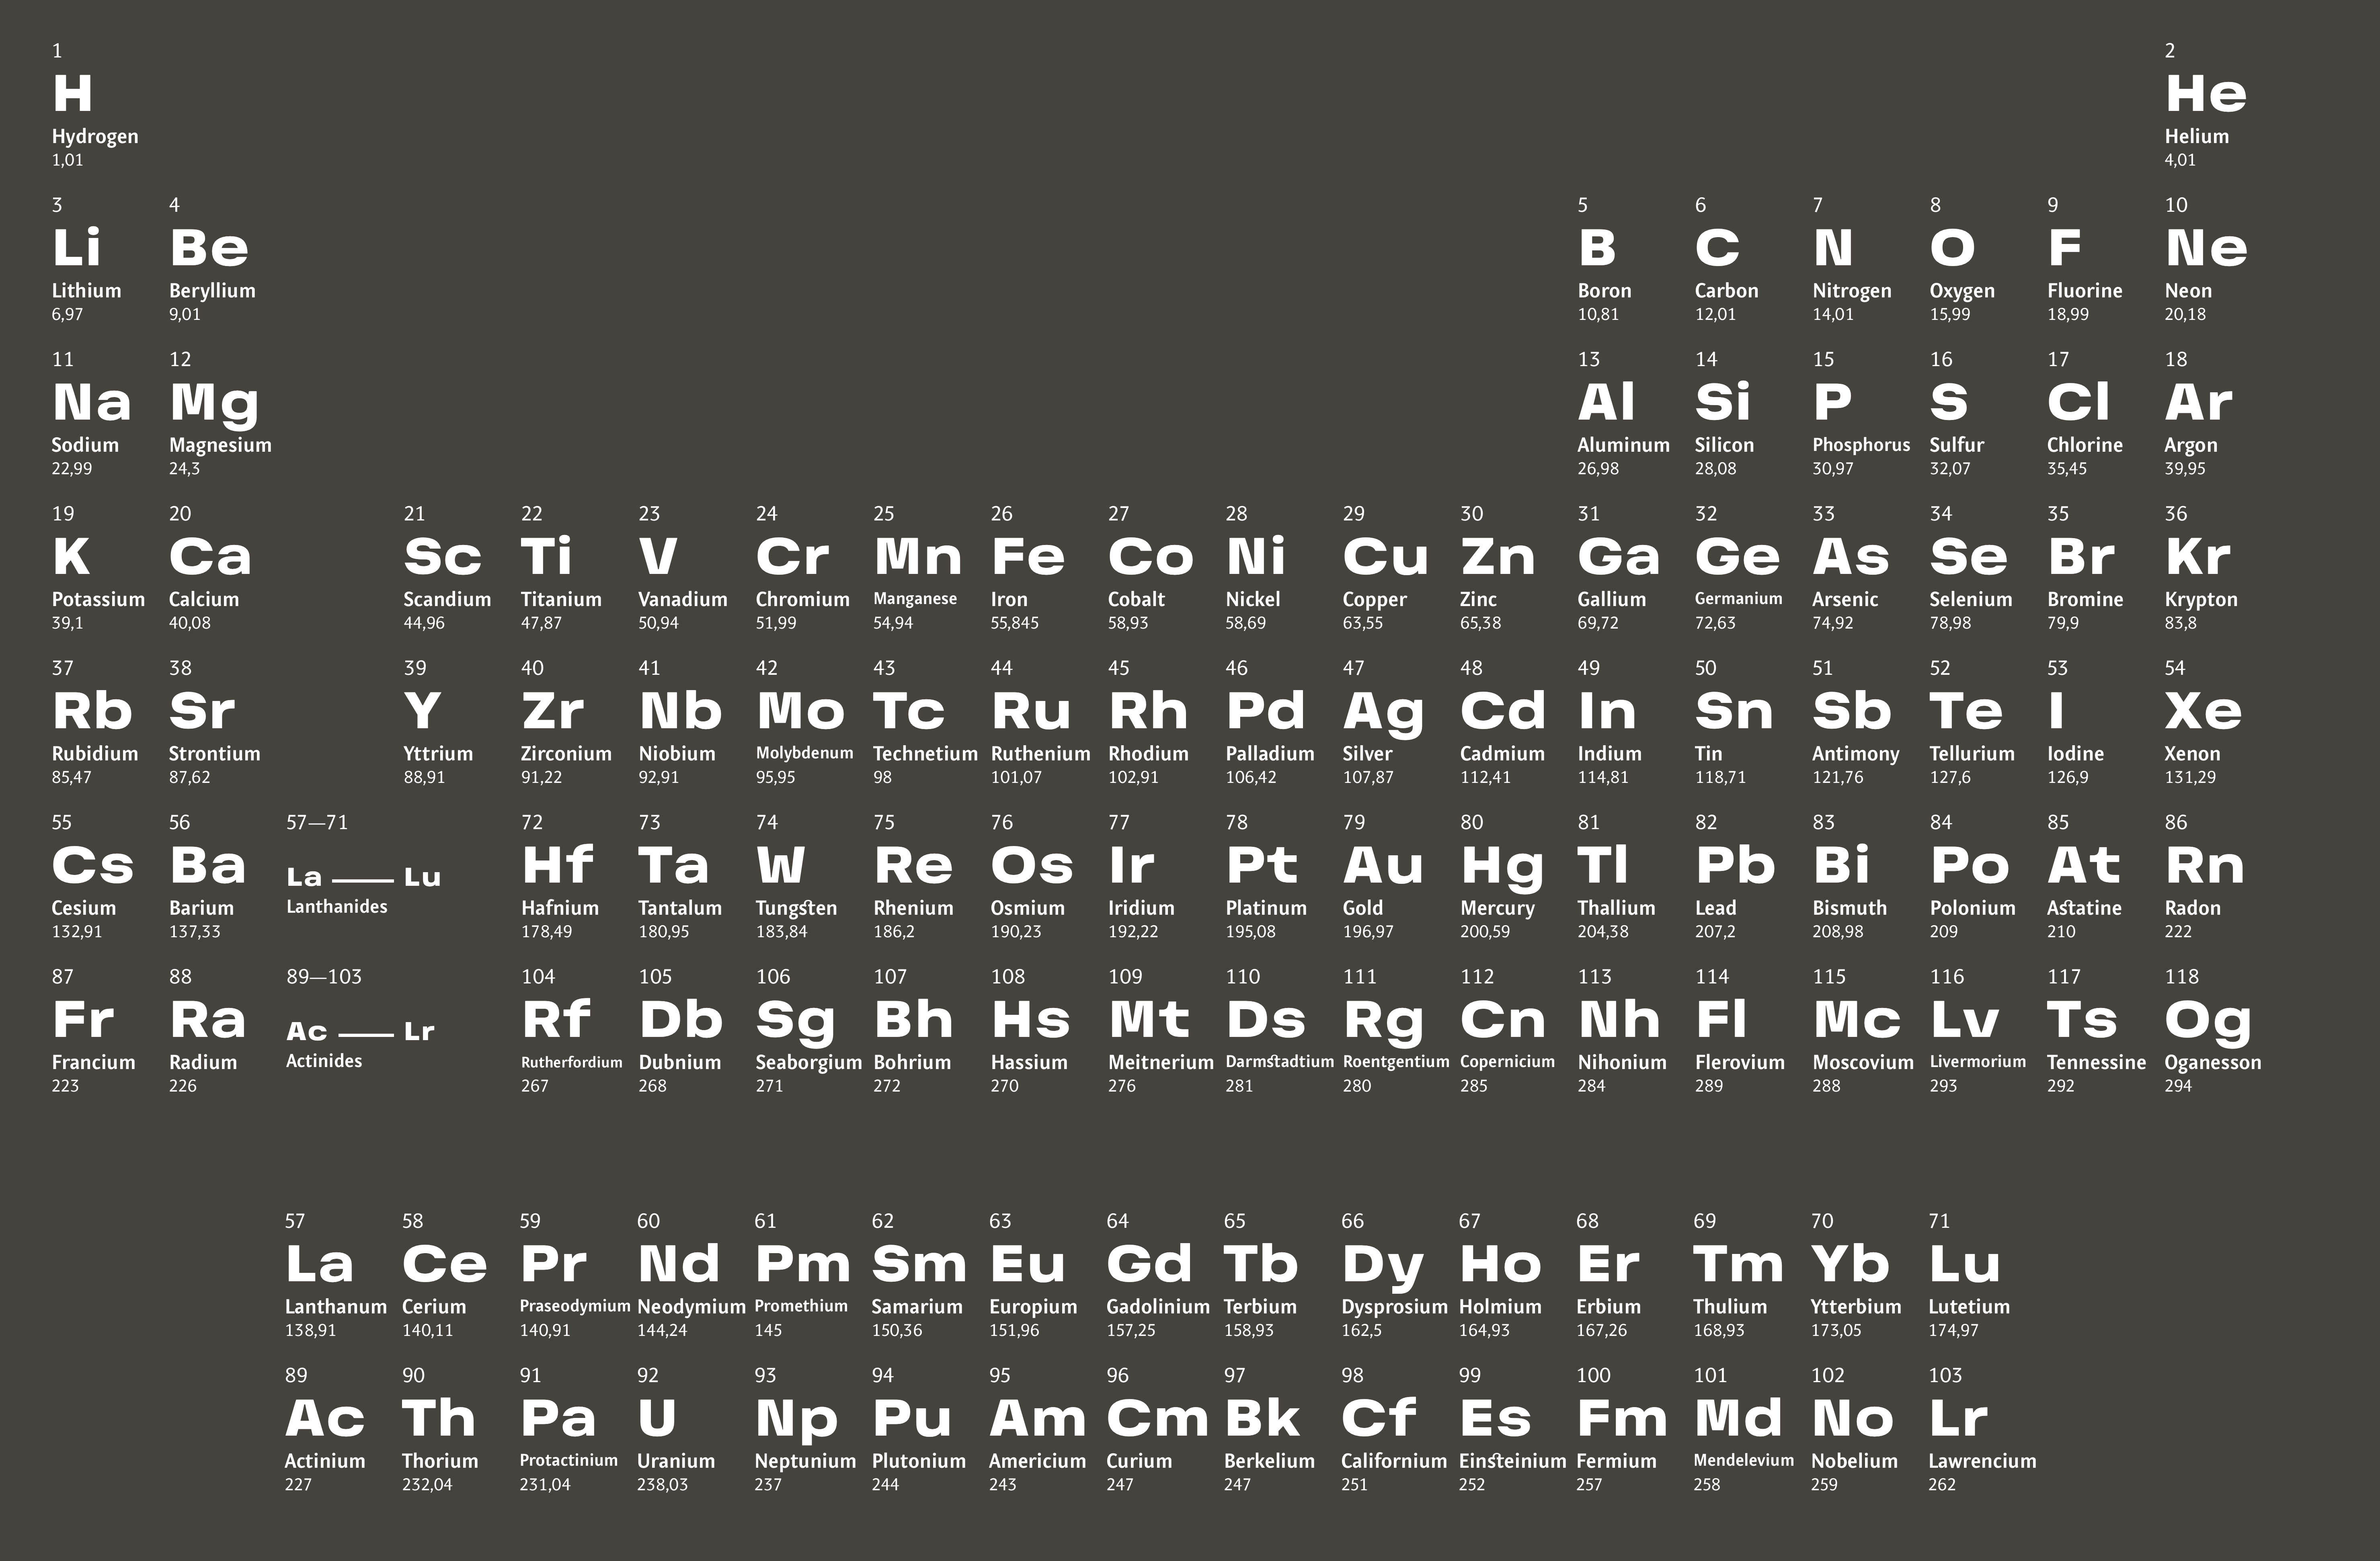
Overall, there are over 100 000 permutations of the table. That means whether you’re a scientist, teacher or student, you’ll be able to find a table that works for you.


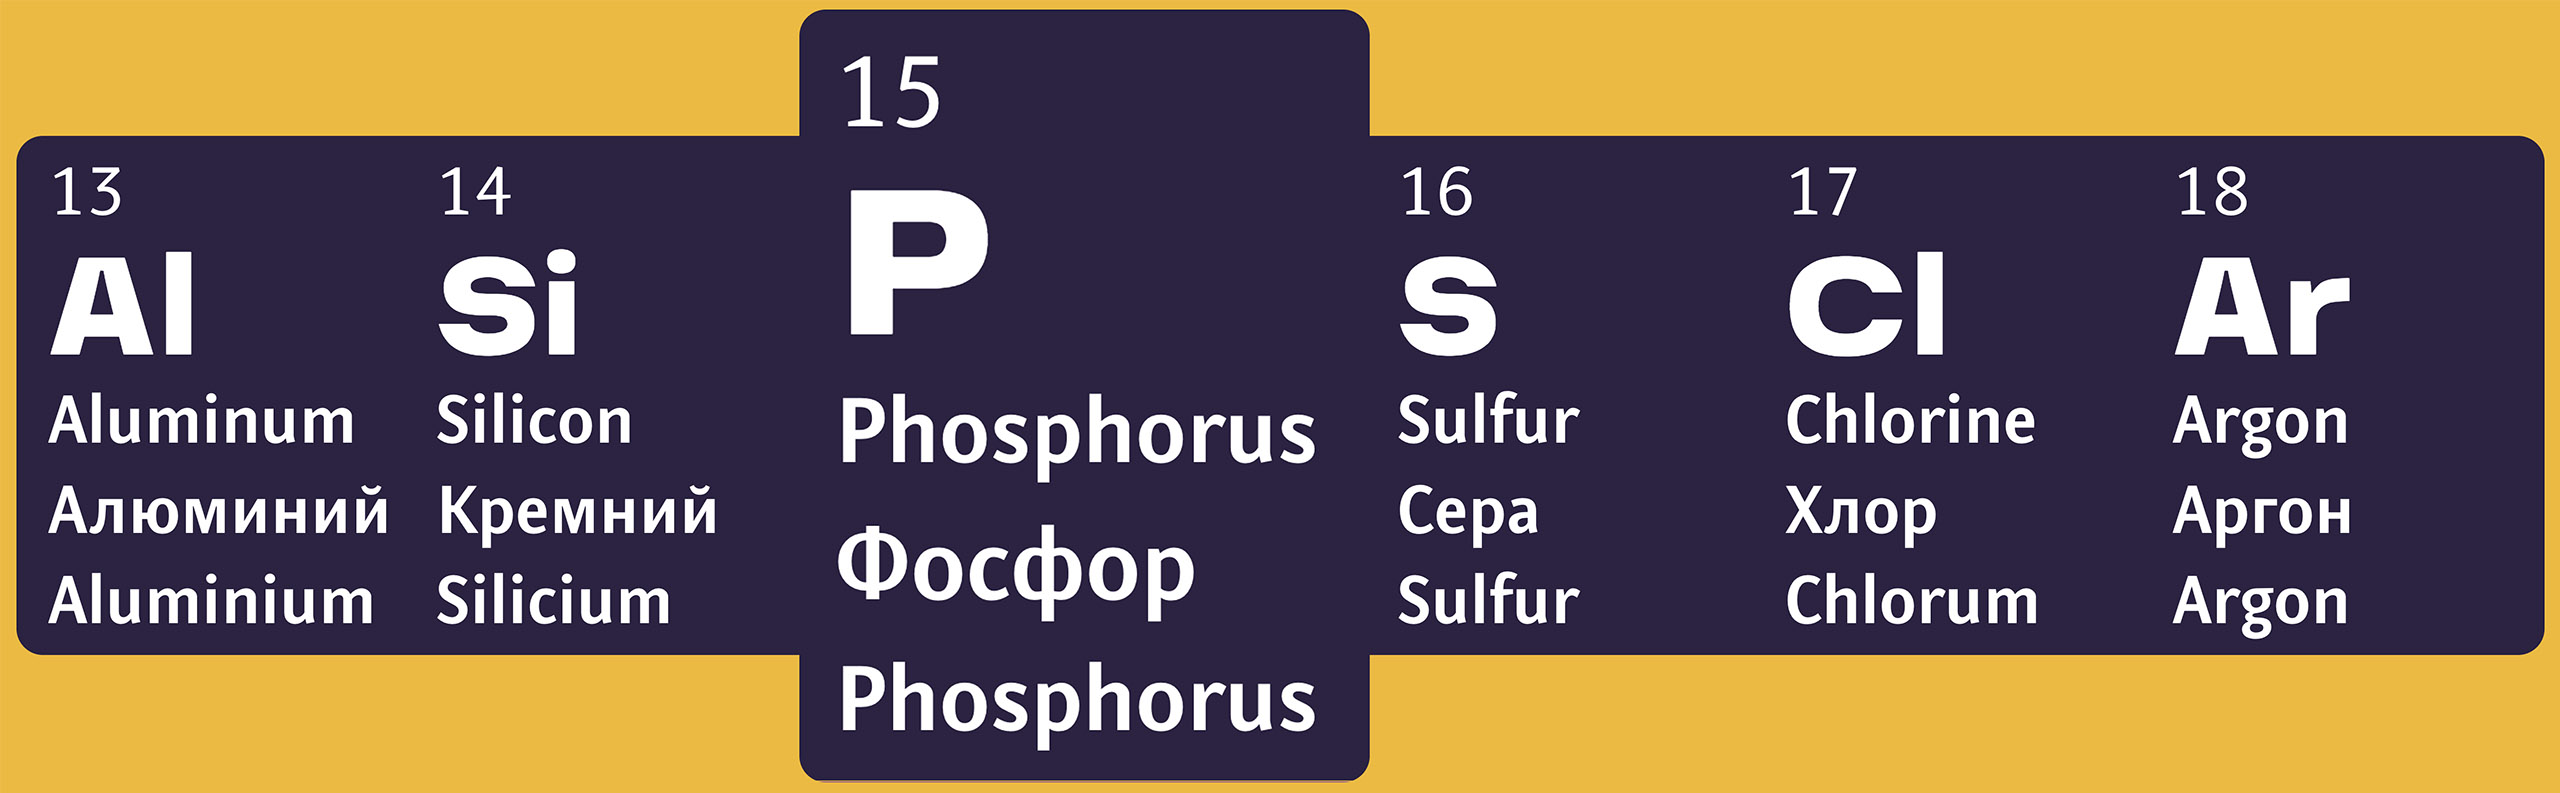
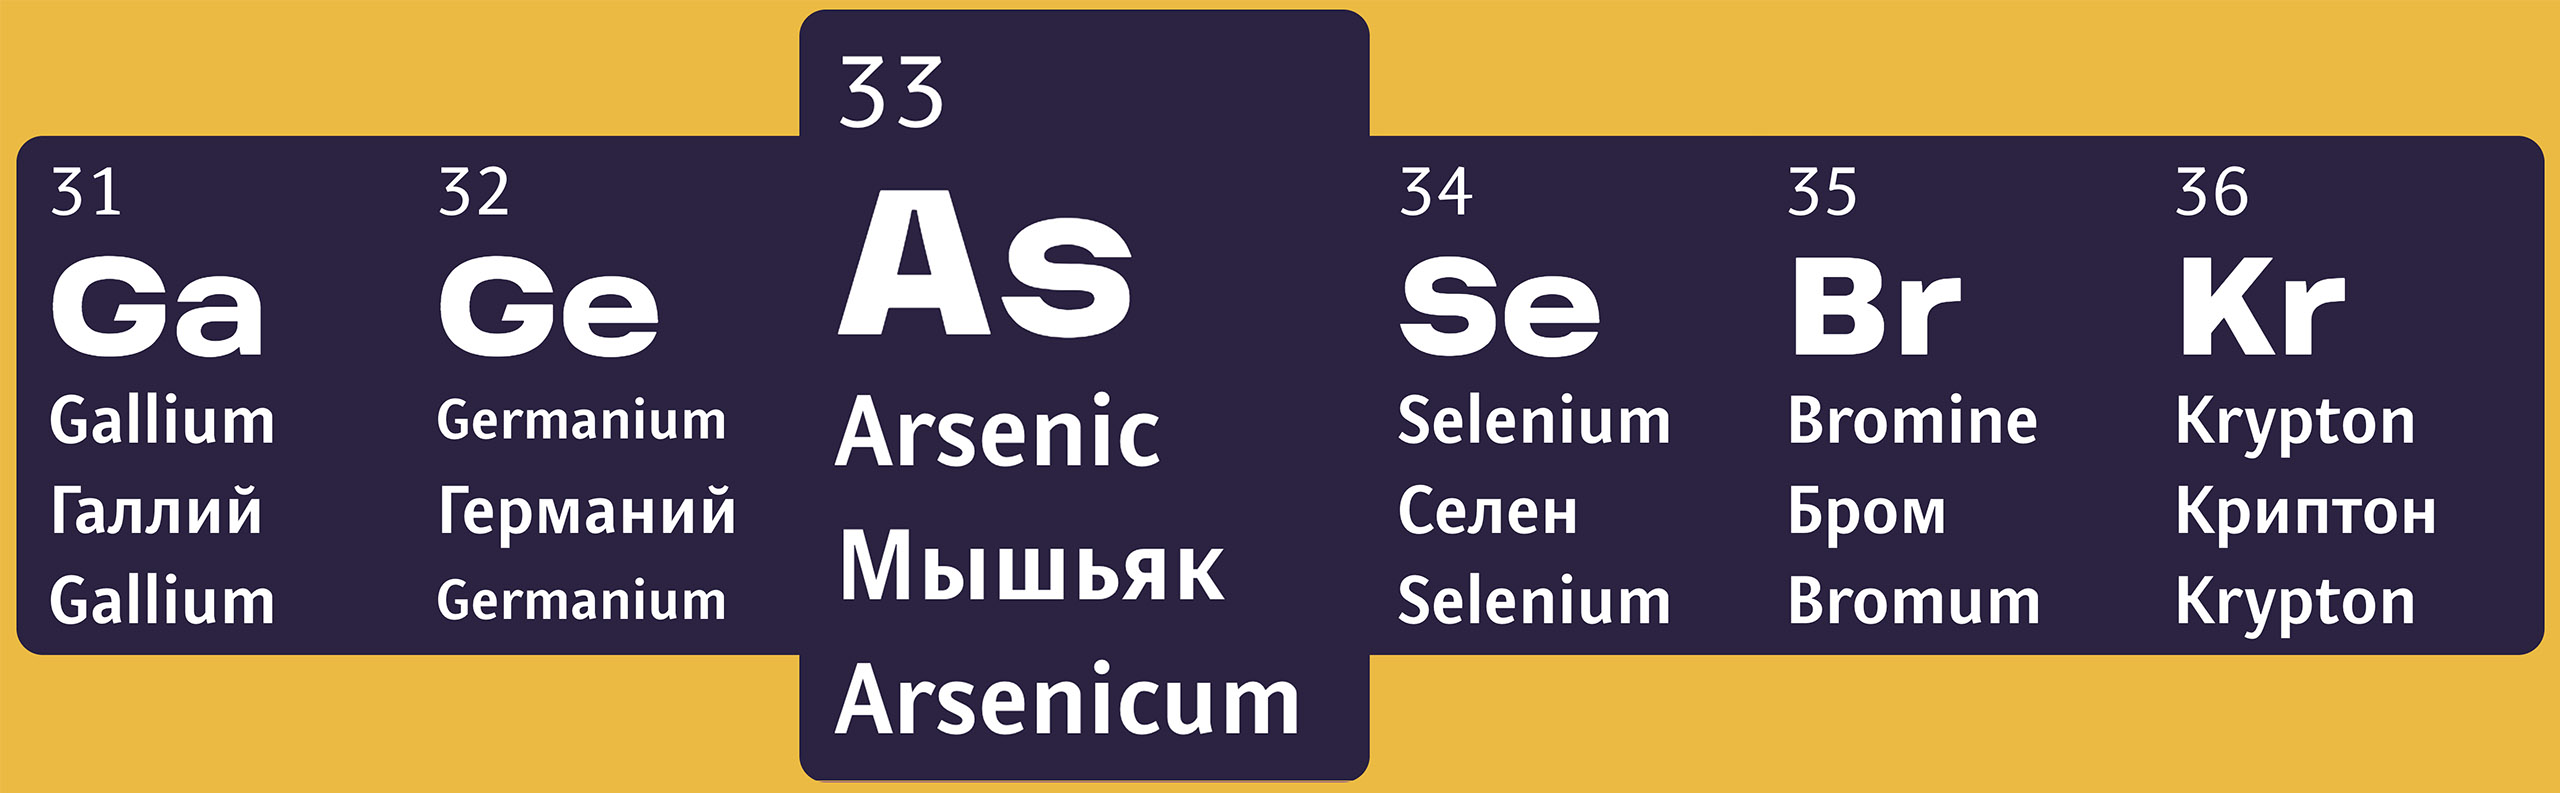
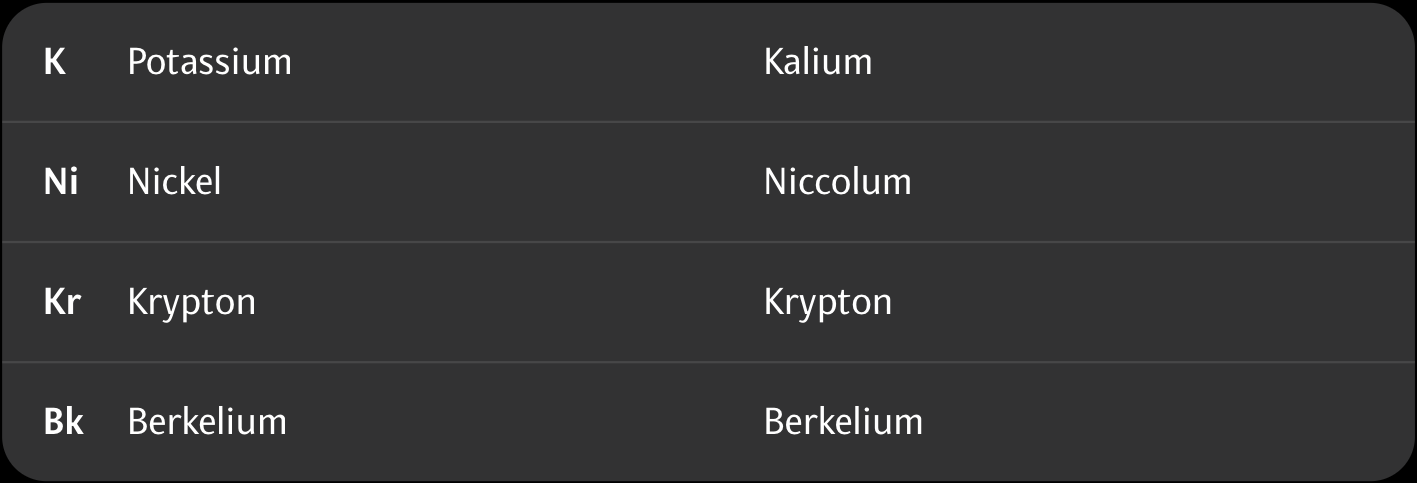
The innovative spirit of the table is reflected in the sharp, eye-catching typeface.

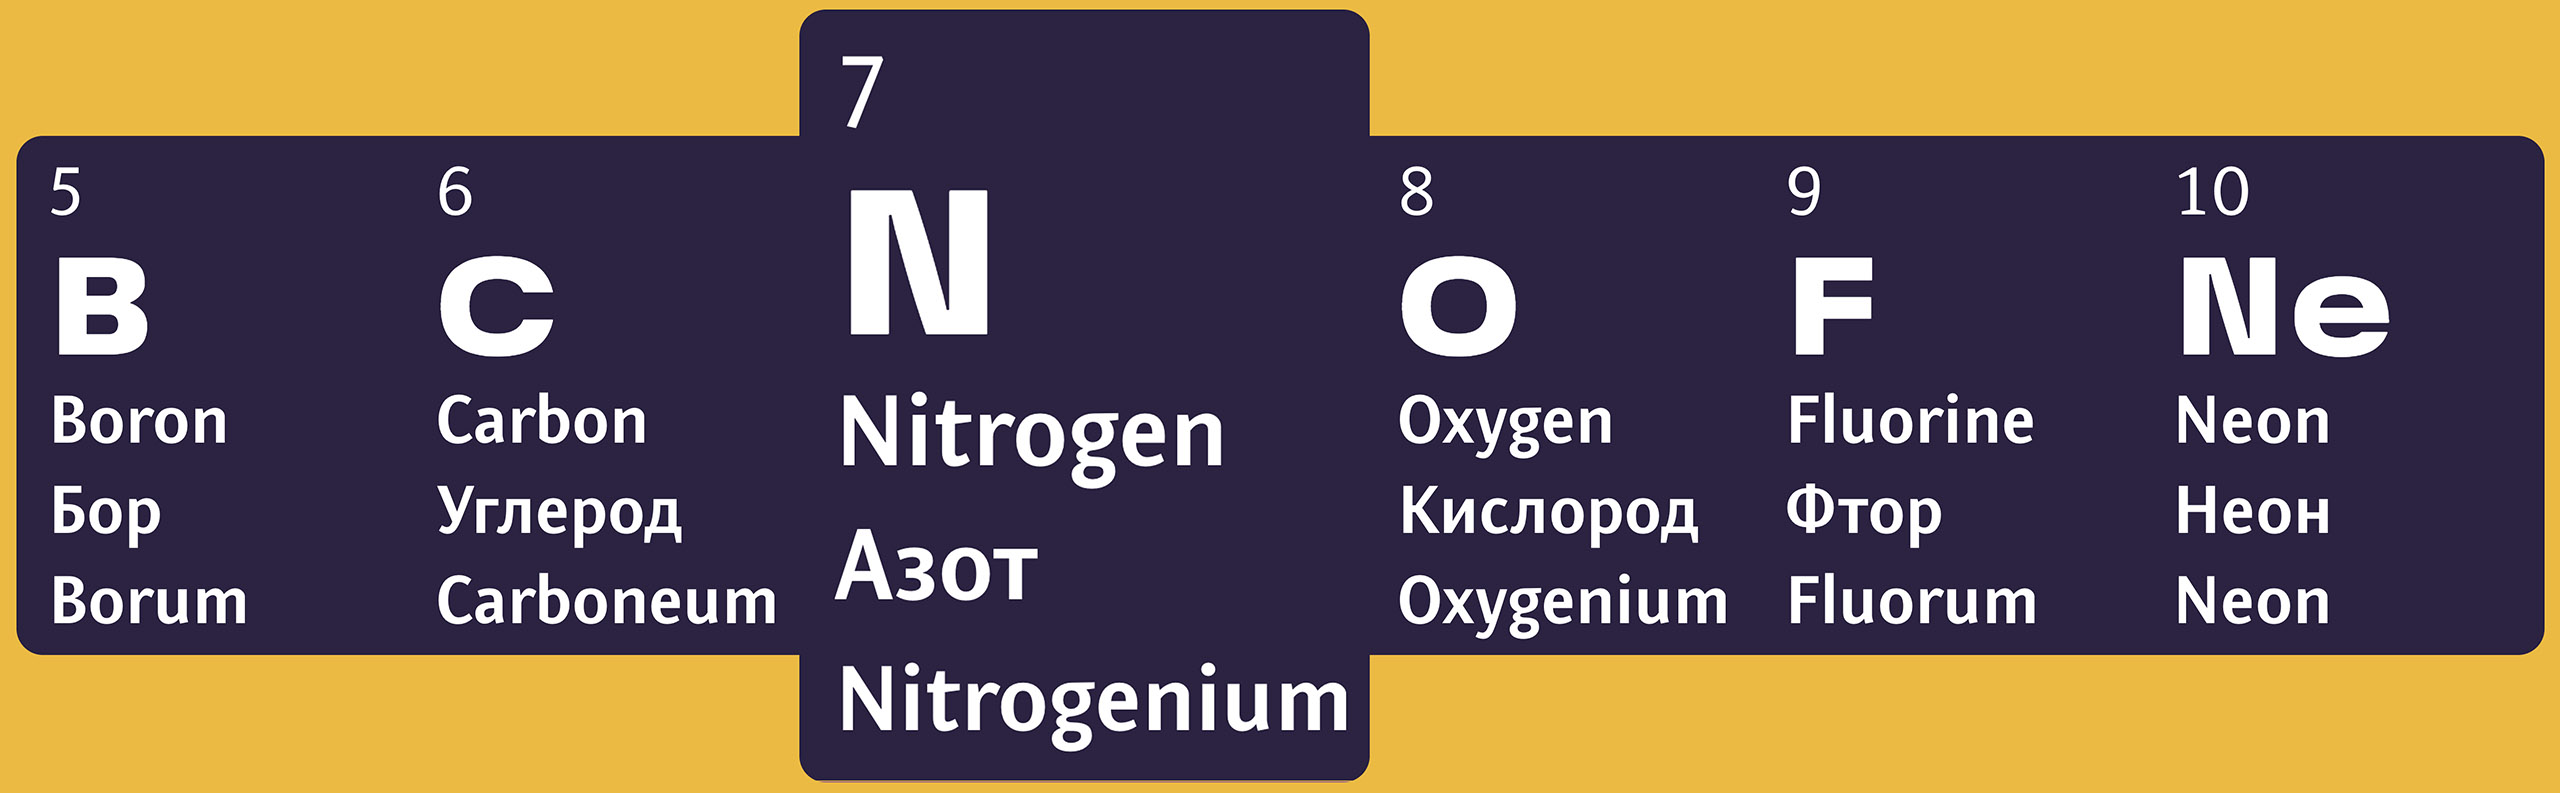
The typeface works well for every element. Each letter combination looks like a standalone logo.
The letters are robust and carry a sense of gravitas. At the same time, the typeface is understated enough to not be a distraction.

No letter looks like any other — each one is simple and recognizable. Misreading names is practically impossible.
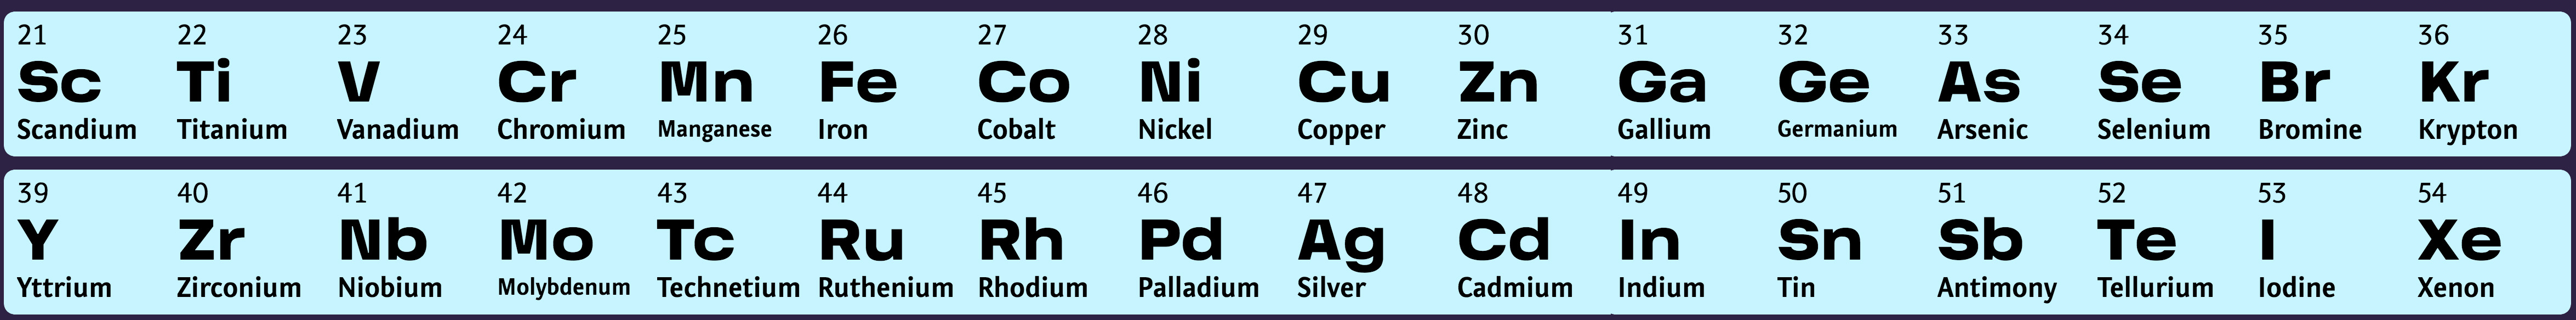

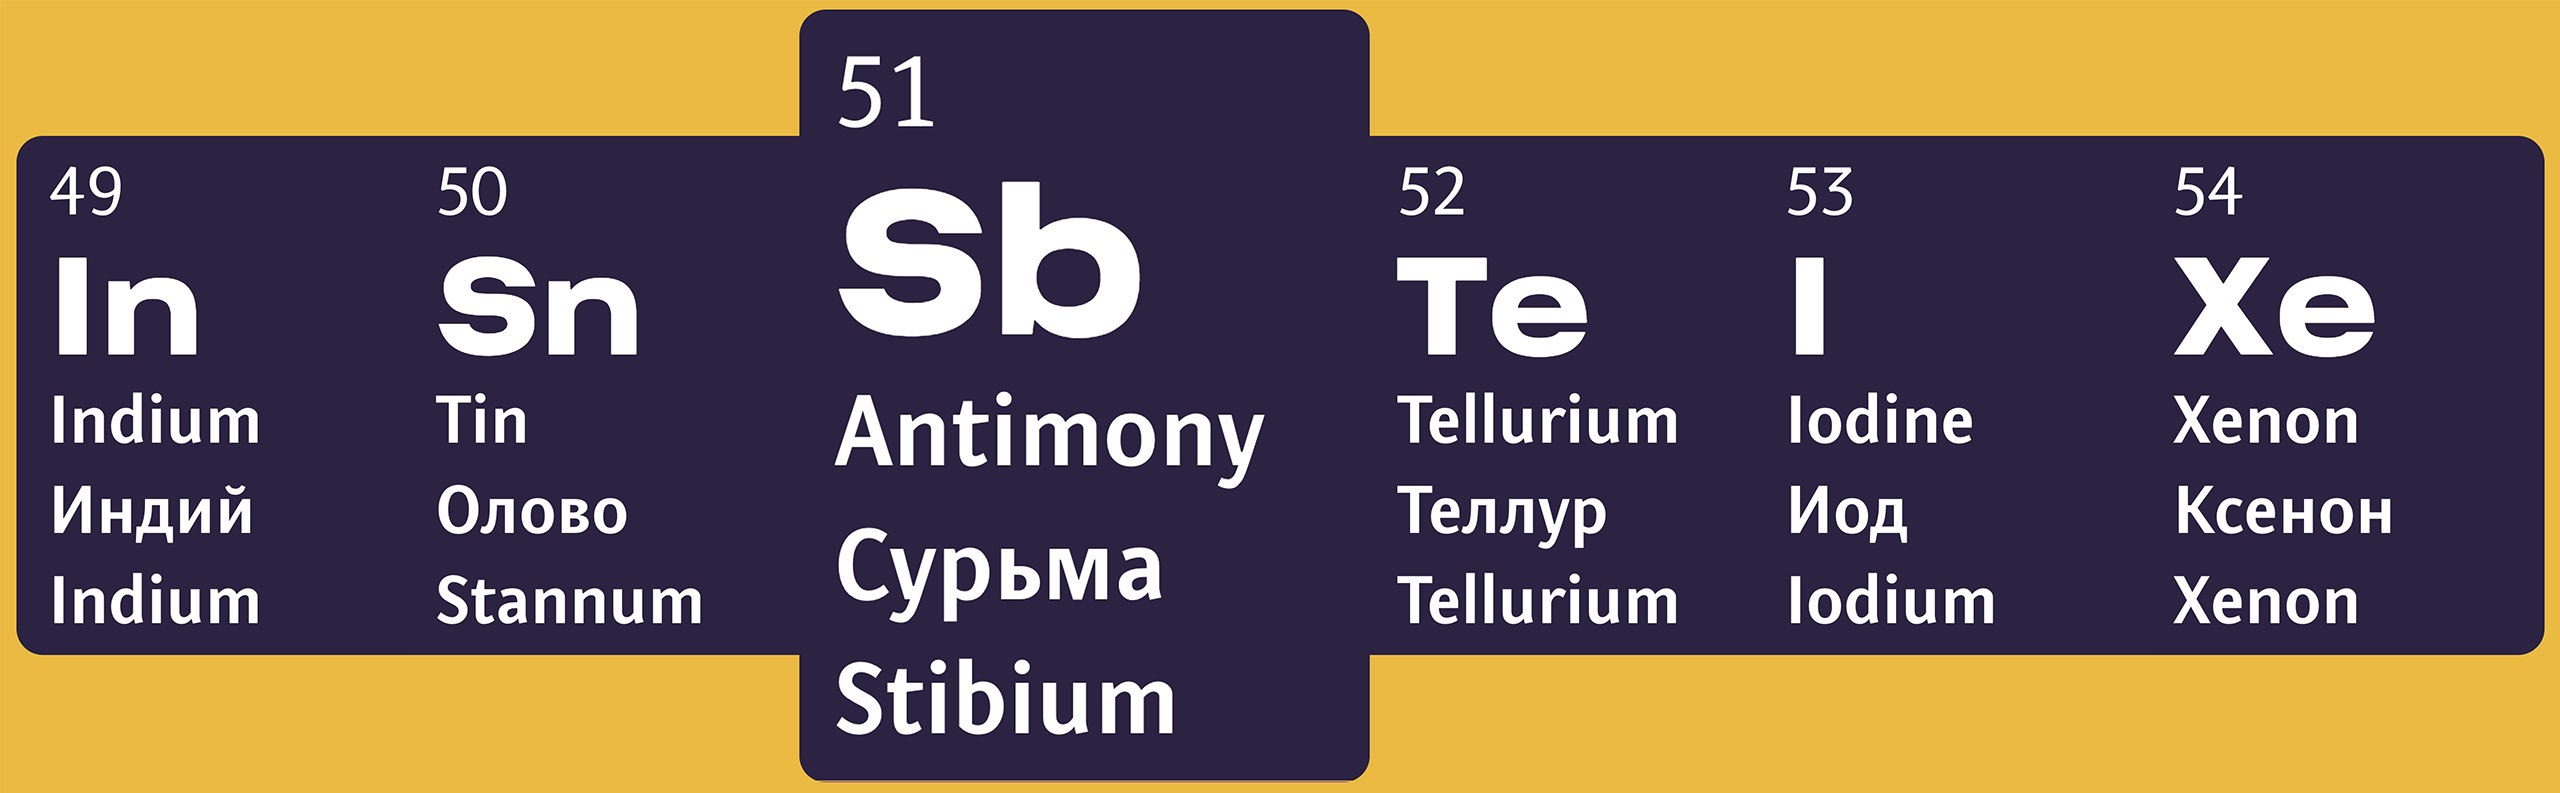
We made the wider letters like M and W more compact to give the entire typeface a more monolithic, tabular feel.
The typeface is universal. It looks just as beautiful in textbooks and booklets as it does on a screen.


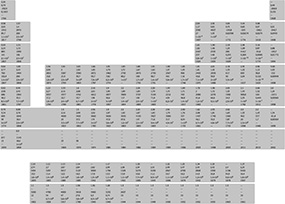
Data analysis
An important part of studying chemistry is understanding the core principles behind the differences between elements.
When a professor says: «Atomic radius increases left to right along a period and decreases top to bottom in a given group,» most students can’t get their heads around it. Budding scientists resort to revealing hidden patterns, gathering data and drawing diagrams by hand.
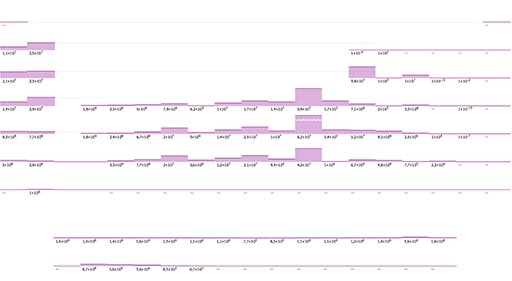
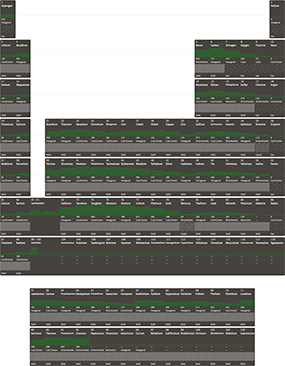
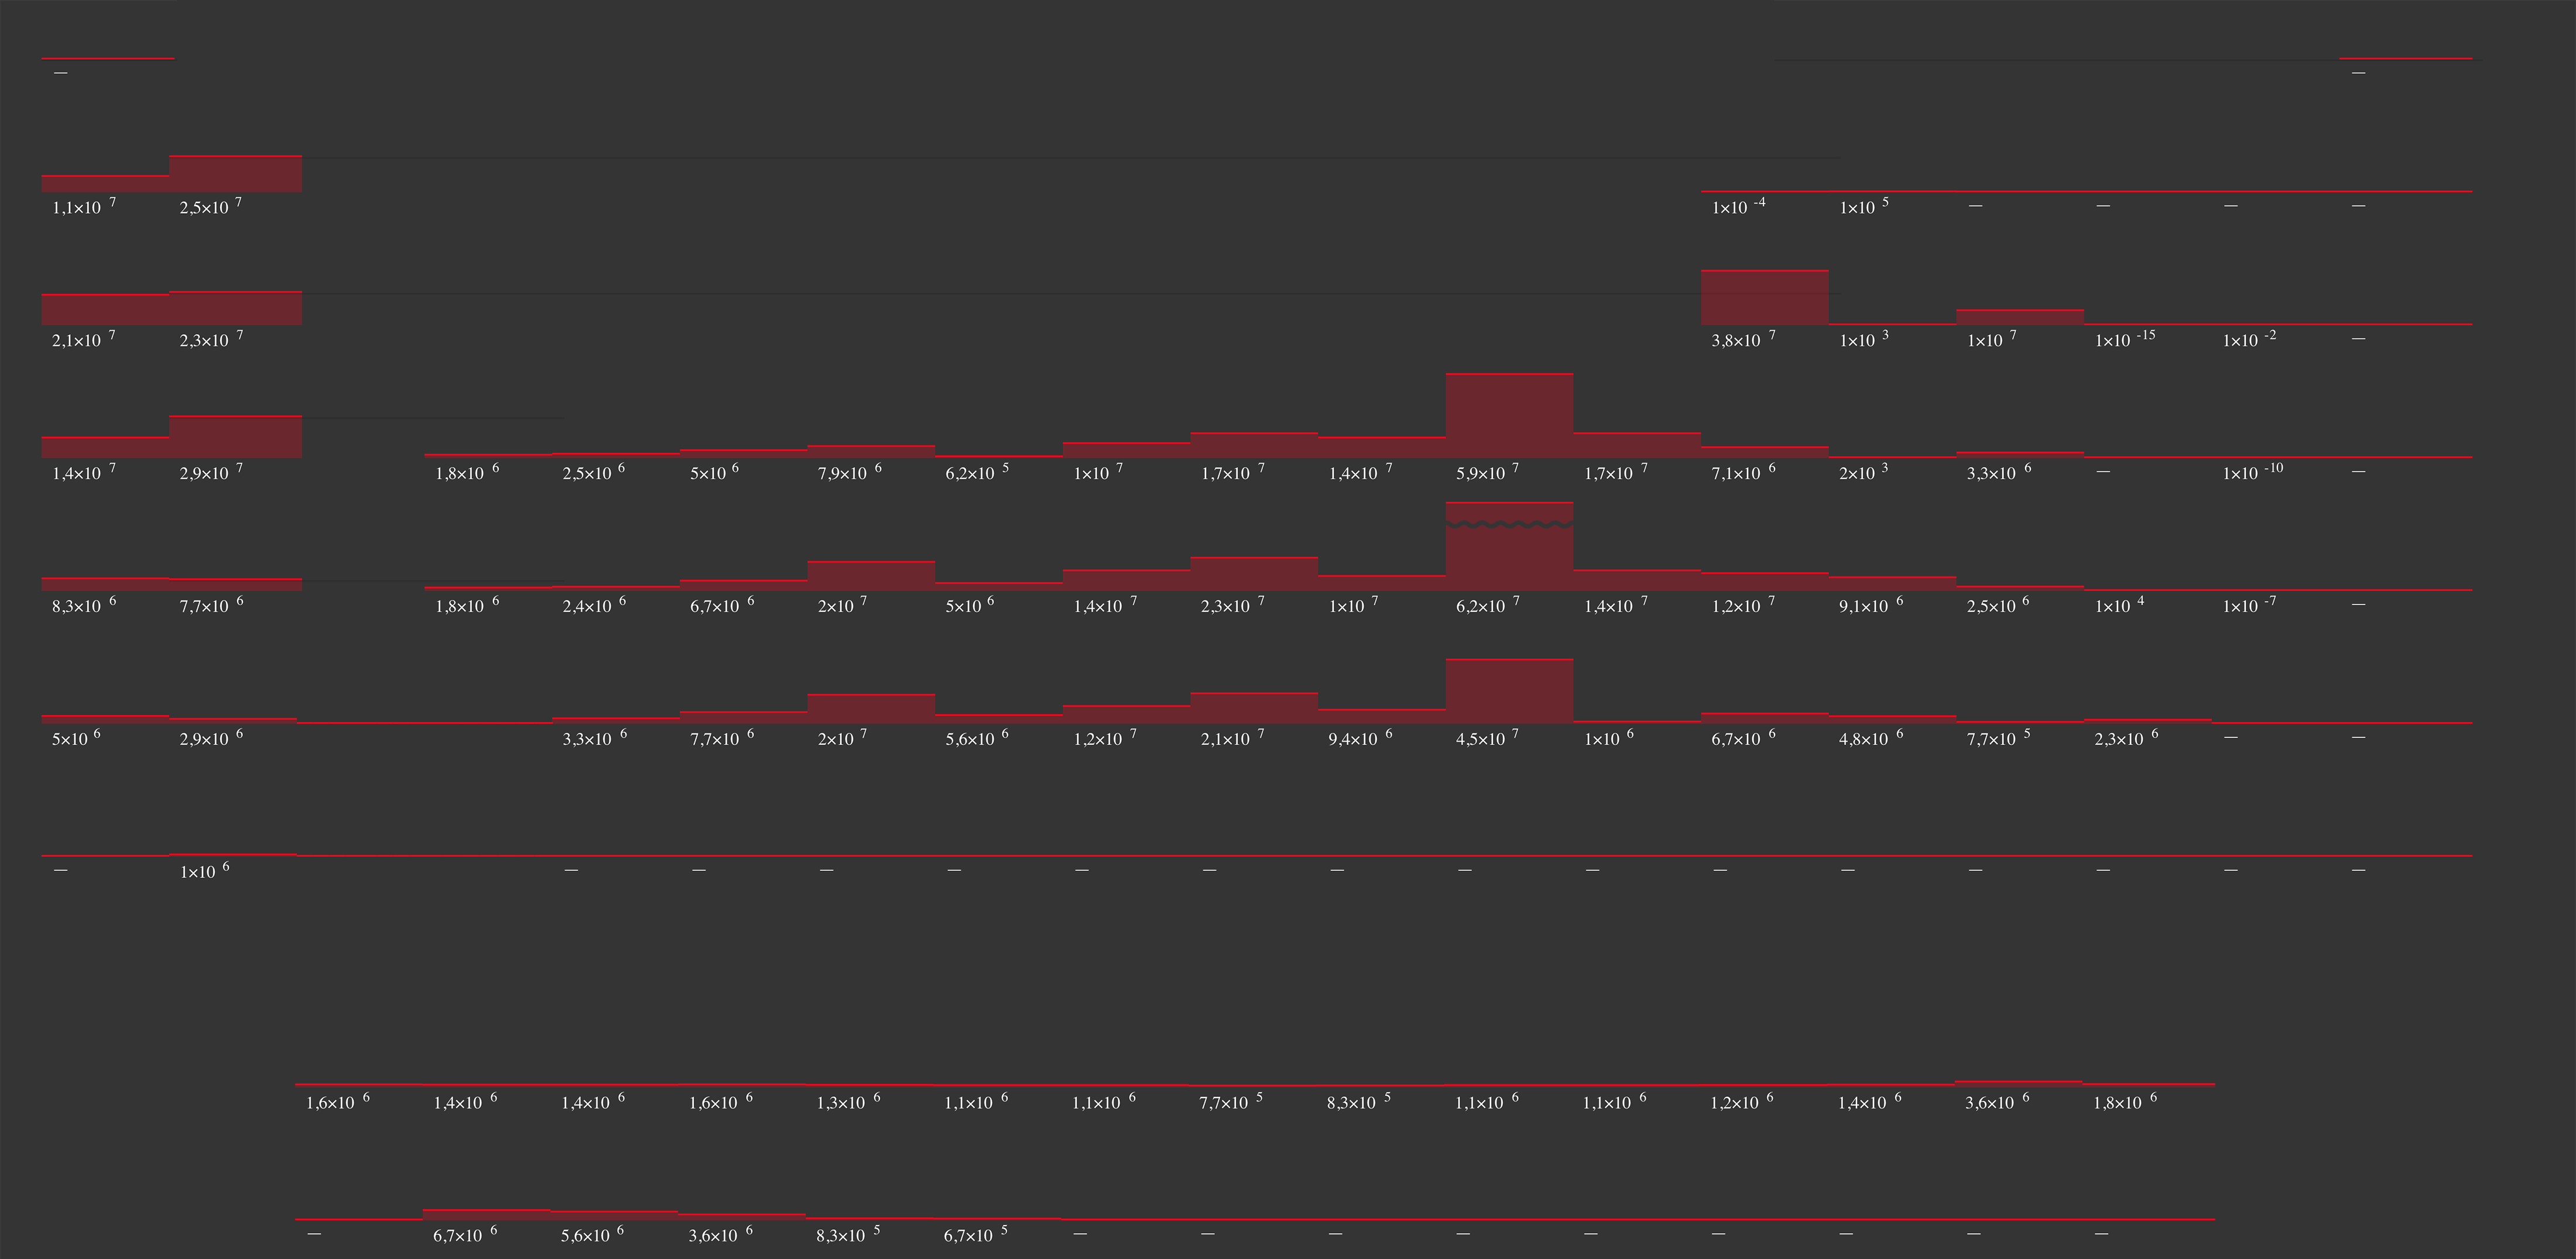
With our table, diagrams which correlate properties can be displayed right inside the cells themselves.
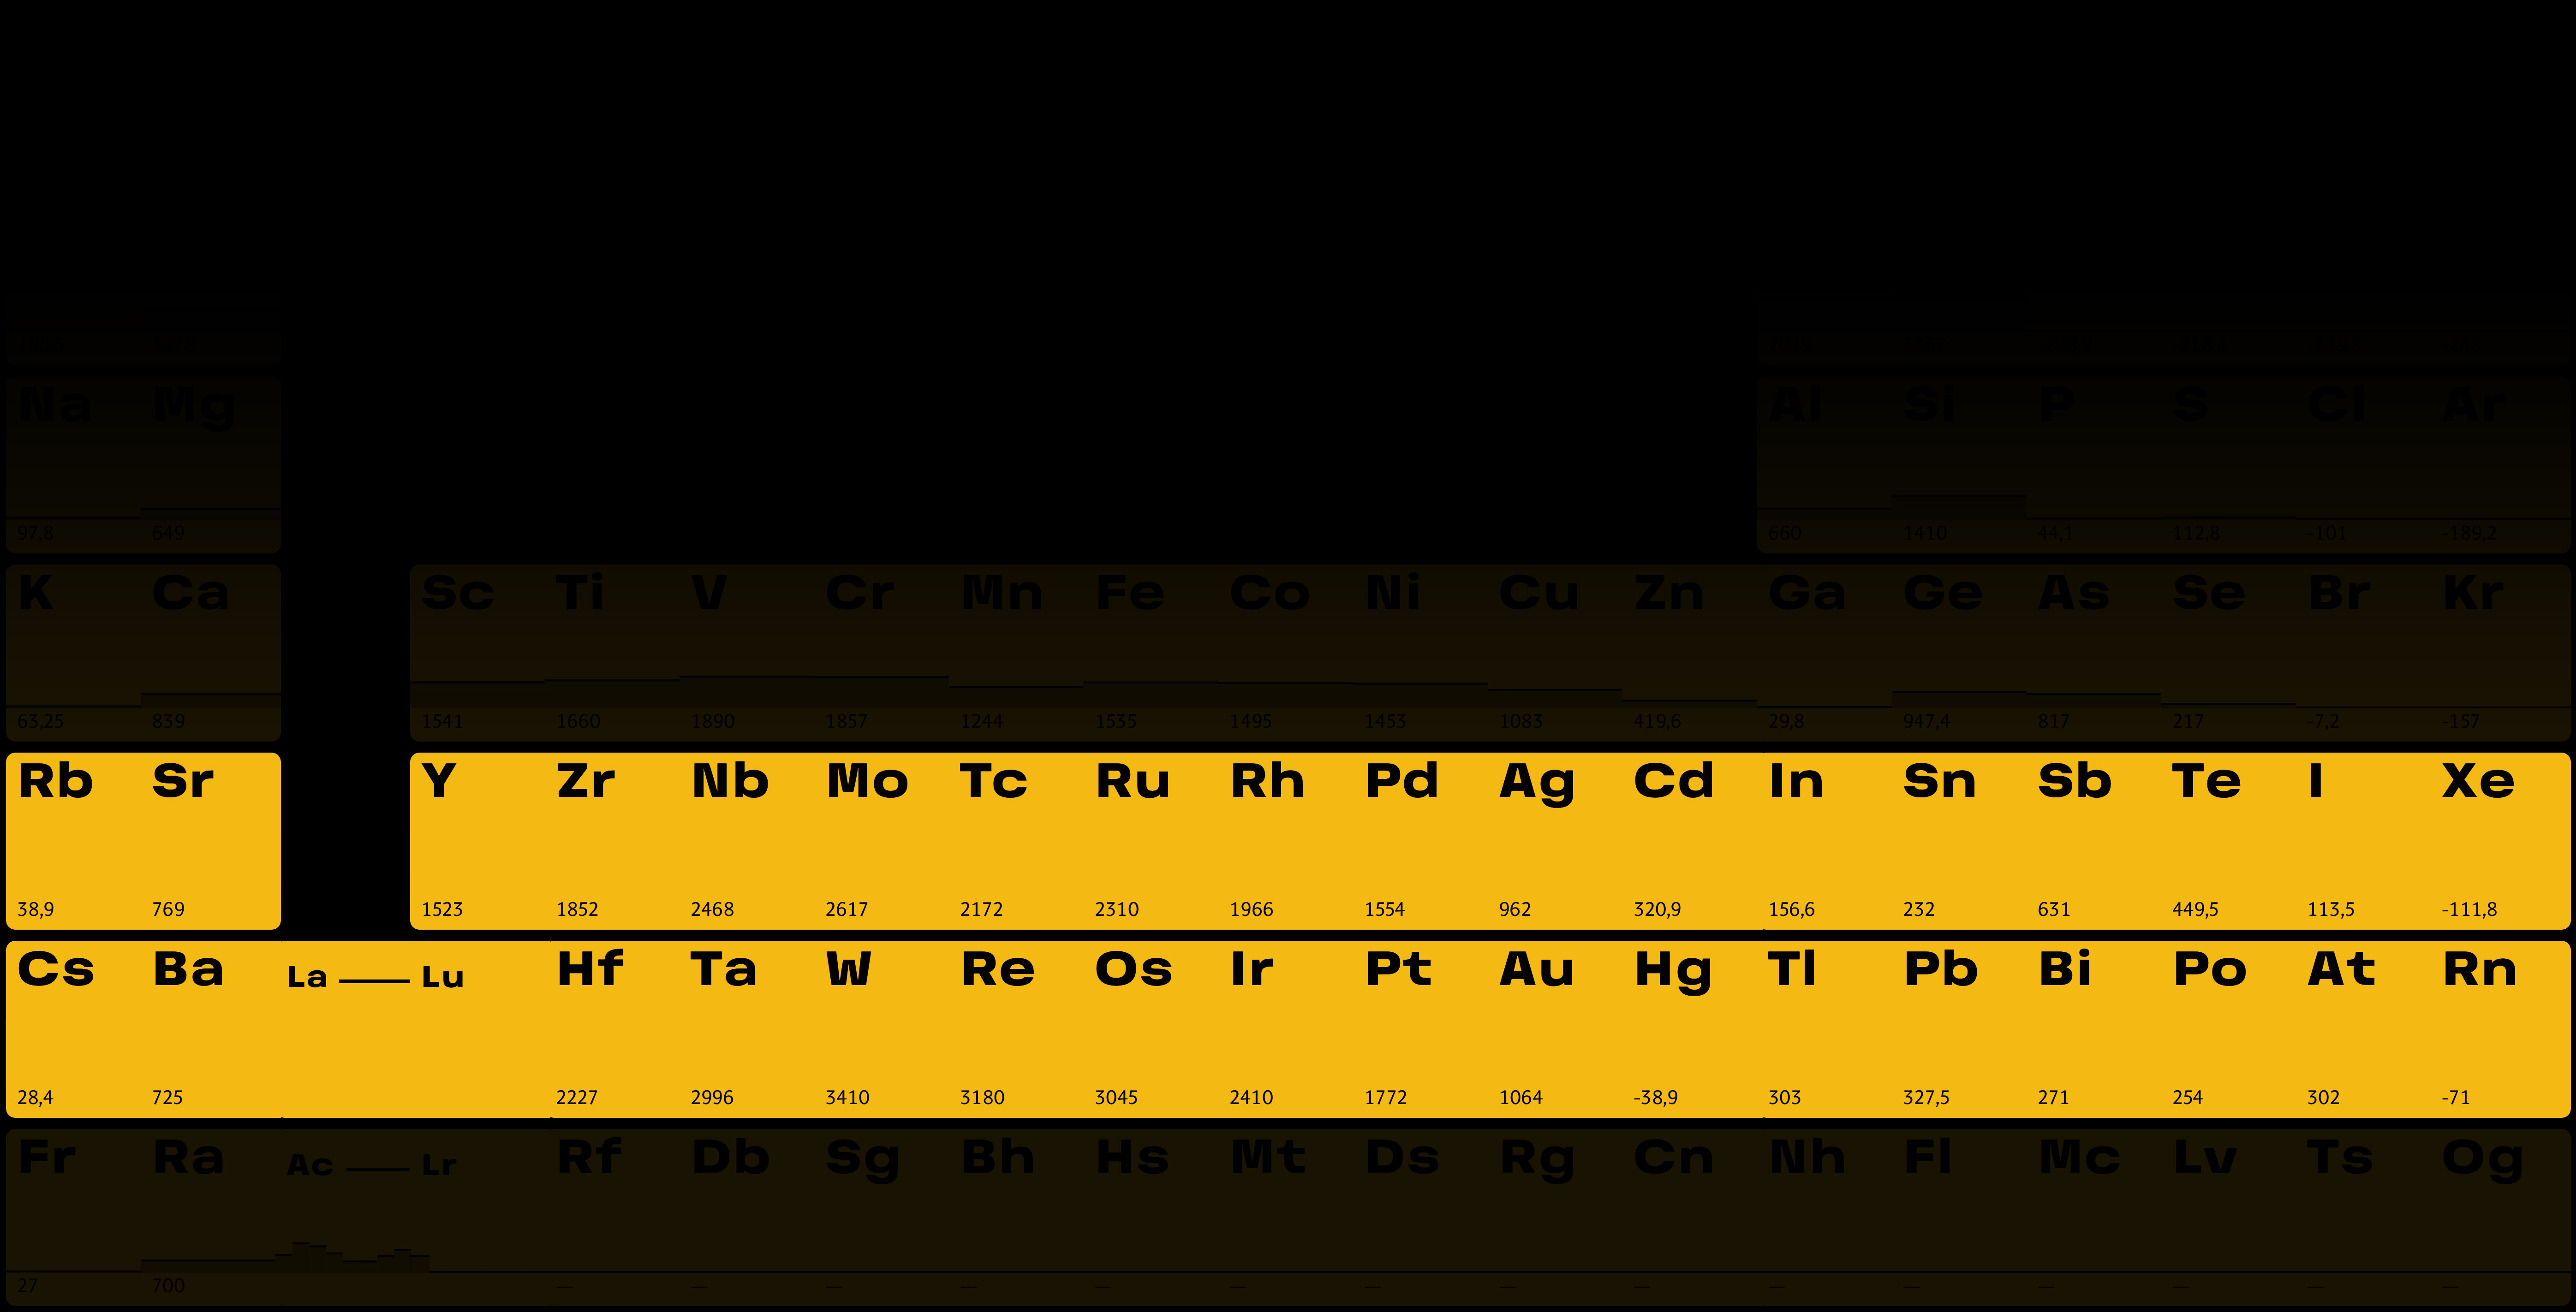
A single click turns a mess of numbers into a clear trend.
Diagrams can be created for all comparable characteristics. The table can display any number of diagrams and, when necessary, all but one can be disabled.
This flexibility gives you complete control over what you want to compare.
You can also view summaries that don’t break data down by periods.
Preset tables help you start working quickly.
The simple search tool helps you find the element you’re looking for.


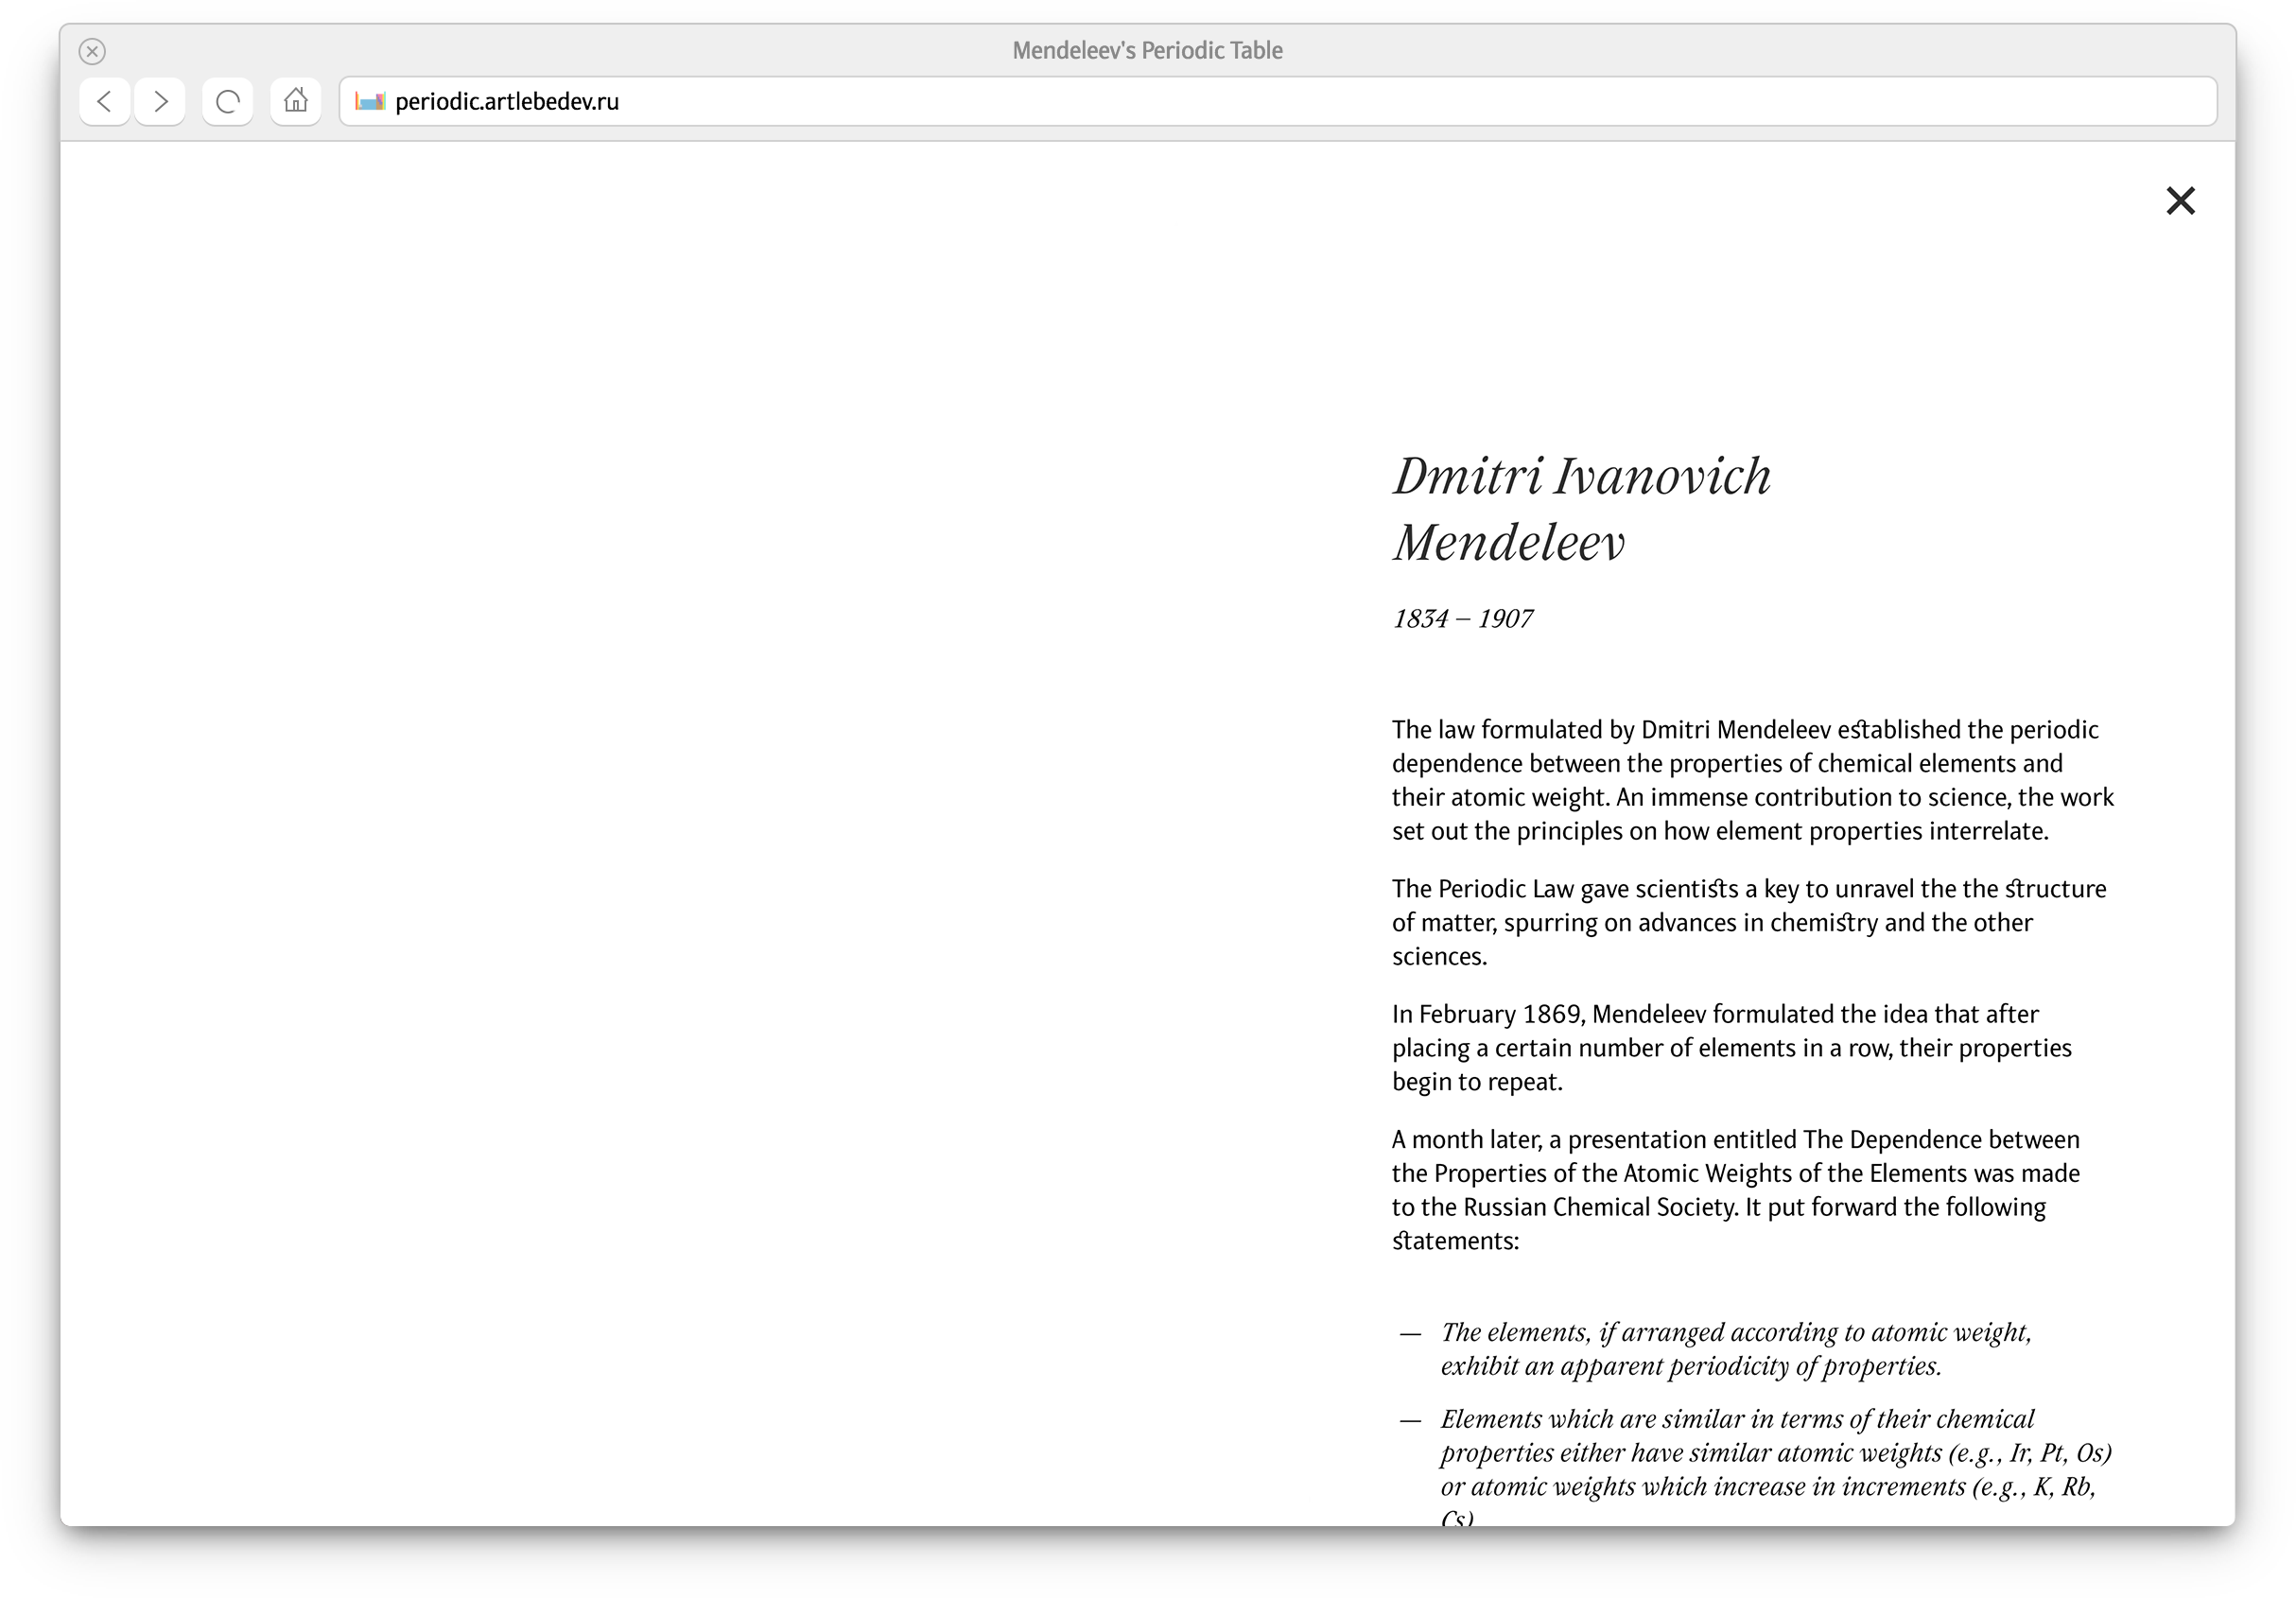
A special section was dedicated to Dmitri Mendeleev, who developed the periodic law.
Mendeleev is usually depicted as an old man:
But he discovered the periodic law when he was just thirty-five! Using archive photos, we were able to recreate a handsome portrait of the scientist in his prime.

translators
illustrators
photographer
project manager
consultant
- Doctor of Chemical Sciences
Oleg Kulinkovich
